
Climate Debt: Finland ranks 13th among 148 countries
Finland’s current Climate Debt is $3,078 per capita and the ‘Ranking’ by January 2016 was 13th among 148 countries, compared to 10th ranked in 2010. The following examines the Finnish CO2 Emissions, Nuclear Power, Forest Cover, Environmental Performance and GDP(ppp-$), in comparison with the four largest trade partners Russia, Germany, Sweden and United Kingdom.

Climate Debt: South Korea now ranks 11th (Nuclear Power generation worsens the trend)
South Korea is responsible for 3.9% of the global Climate Debt of $5.7 trillion, accumulated since 2000. The per capita Climate Debt is $4,404 which ‘Ranks’ South Korea 11th among 148 countries, compared to 12th in 2010. Rankings are available in the menu “Climate Debt”. The following examines the CO2 Emissions, Nuclear Power, GDP(ppp-$) and Climate Debt, in comparison with four other large Nuclear Power generators.
The first diagram shows the South Korean per capita CO2 Emissions from fossil fuels (without bunker fuels) and cement production in decades in comparison with the world average. CO2 Emissions since 2012 are preliminary estimates. From 7.6 tons in the 1990s the level increased to 11.8 tons on average between 2000 and 2014 (preliminary). The green bars are the Climate Debt Free Level in ClimatePositions, determined by the level of emissions in the 1990s and a number of continuously updated ‘Indicators’.

Saudi Arabia’s climate destruction proceeds (bankruptcy is a ship on the horizon, though)
The per capita Climate Debt of Saudi Arabia accumulated since 2000 is now $7,251 which ranks the wealthy oil-state 6th among 148 countries. The Saudi climate change financing to developing countries is zero dollars.
The first diagram (below) shows Saudi Arabia’s per capita CO2 Emissions from fossil fuels (without bunker fuels) and cement production in decades in comparison with the world average. CO2 Emissions since 2012 are preliminary estimates. The green bars are the Contribution Free Level, determined by the level of CO2 Emissions in 1990s and a number of continuously updated ‘Indicators’. The Saudi emissions were 13.8 tons annually in the 1990s, on average, and 18.7 tons between 2010 and 2014 (preliminary).
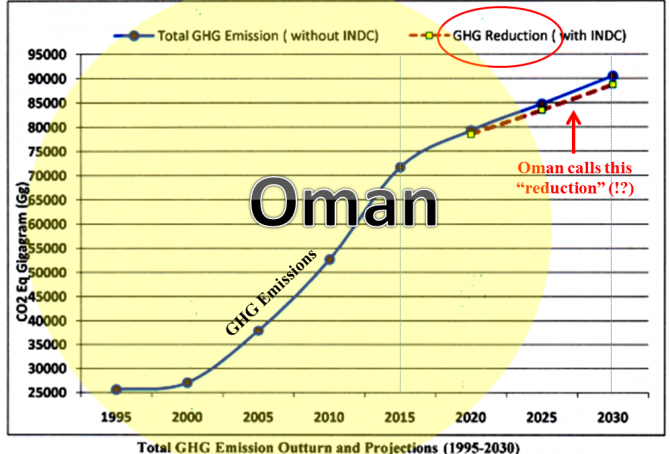
Climate Debt: Oman ranks 5th (more emissions to come!)
The current Omani Climate Debt, accumulated since 2000, is $9,645 per capita and the ‘Ranking’ is 5th among 148 countries. According to the bizarre Omani ‘COP21 Submission 2015’ the wealthy authoritarian oil state is planning to increase GHG-emissions by only(!?) 22% by 2030 compared to 2015. The implementation of this (extremely climate destructive) target is, even more ludicrous, conditioned upon “assistance provided by the UNFCCC on finance, capacity building and transfer of technology”. The following examines Oman’s CO2 Emissions, Environmental Performance, GDP(ppp-$) and Climate Debt.

Russia’s Climate Debt keeps accelerating (however, the Environmental Performance has improved)
The accumulated Russian per capita Climate Debt is ranked 25th among 148 countries. Back in 2010 the ranking was 33rd. The reckless development also shows in Russia’s share of the global Climate Debt: 3.9% by January 2016 compared to 3.0% in 2010. Rankings are available in the menu “Climate Debt”. The following examines the development of CO2 Emissions, Environmental Performance, GDP(ppp-$) and Climate Debt, in comparison with some of ‘Russia’s largest trading partners’.
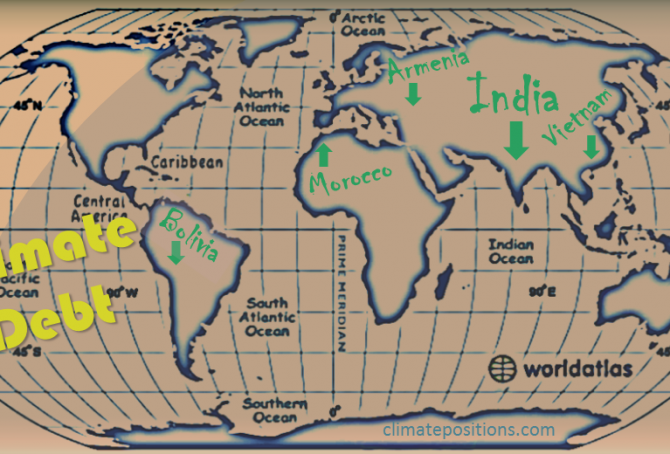
India’s Climate Debt is on track for something big
2016
India’s accumulated Climate Debt is $13 per capita which ranks the populous country 84th among 148 countries (see the ‘Ranking’). The current share of the fast growing global Climate Debt is 0.29%, compared to 0.04% in 2010. The following examines India’s CO2 Emissions (the increase-rates is compared to the historic Chinese rates), Environmental Performance, GDP(ppp-$) and Climate Debt in comparison with Vietnam, Morocco, Armenia and Bolivia, all ranked between 77th and 82nd.

Climate Debt: Kuwait ranks 2nd … however, soon with “cleaner” fossil fuels!?
The current Kuwaiti Climate Debt, accumulated since 2000, is $26,347 per capita and the ‘Ranking’ is 2nd among 148 countries. However, the extremely wealthy authoritarian oil state plans to generate a “low carbon economy” by creating “refinery alternatives with lower emissions and produce cleaner fuels” … according to a Google translation of the COP21 Submission 2015, written only in Arabic, Kuwait claims to be a developing country and consequently it expects developed countries to pay for its climate change mitigation, technology transfer etc. All this is of course greedy nonsense and inconsistent with the collectively agreed “efforts to limit the temperature increase to 1.5°C.” Seriously, the Kuwaiti problem is this: Around 61% of all known extractable gas reserves in Middle East and 38% of all known oil reserves will have to stay in ground beyond 2010 if global warming is to be limited to 2°C¹. Once a schedule for such a genuine low carbon economy is on track, Kuwait might again become a developing country with reasonable funding wishes. The following examines Kuwait’s CO2 Emissions, Environmental Performance, GDP(ppp-$) and Climate Debt.
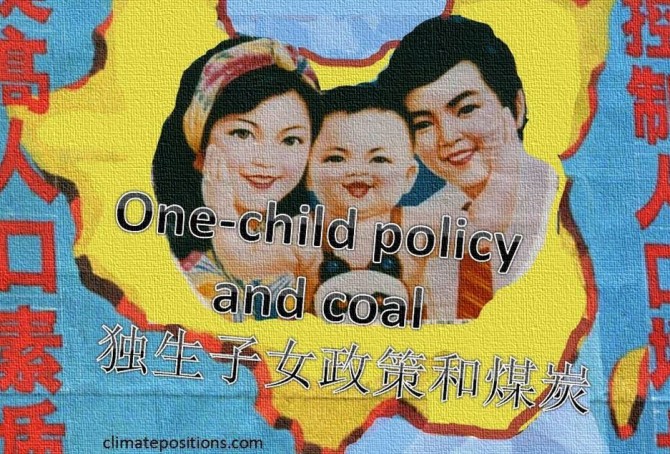
China’s share of the global Climate Debt is growing fast
In 2010 China’s share of the global Climate Debt was 7.4% and by January 2016 it has grown dramatically to 13.3% (see the ‘ranking’). Since 2000 the Chinese share of the growing global CO2 Emissions has grown from 13.7% to about 29.0% (preliminary emissions by 2014). Luckily, the populous superpower has committed itself to pursue “efforts to limit the temperature increase to 1.5 °C” … according to the COP21 Paris Agreement. The following examines the development of CO2 Emissions, Environmental Performance, GDP(ppp-$), Climate Debt and Population (with respect to the one-child policy).

The United States’ huge share of the growing global Climate Debt is decreasing
Worldwide, eyes are on the United States due to its massive historic greenhouse gas emissions and its sabotage of attempts to reach a fair and globally binding reduction agreement. Instead, the world is stocked with “intended nationally determined contributions towards achieving the objective […] consistent with holding the increase in the global average temperature to well below 2°C above preindustrial levels and pursuing efforts to limit the temperature increase to 1.5°C.” If this baloney-goal is to be taken seriously, then the United States must cut emissions from fossil fuels by around 80% (give and take), within fifteen years, or so. The following examines the development of CO2 Emissions, Environmental Performance, GDP(ppp-$) and accumulated Climate Debt.
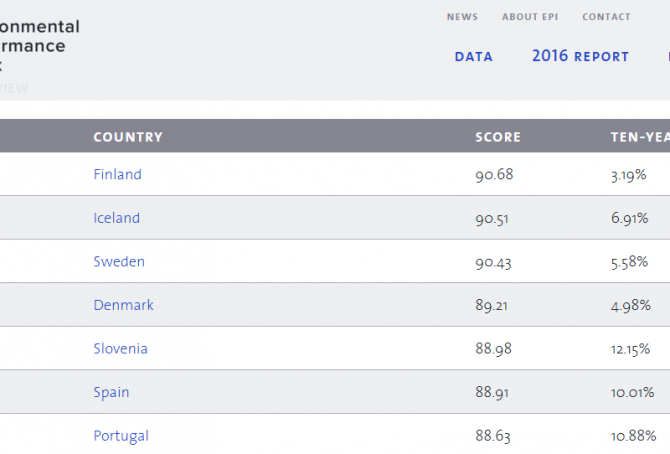
Environmental Performance Index 2016: Ranking of 180 countries
Every second year Yale and Colombia Universities, in collaboration with the World Economic Forum, publish an Environmental Performance Index (EPI) with global ranking. The 2016 edition with ‘Ranking of 180 countries‘ is now available – click on individual countries at the sourse to see more details on Biodiversity and Habitat, Forests, Climate and Energy, Fisheries, Agriculture, Water Resources, Water and Sanitation, Health Impacts and Air Quality. Scores are converted to a scale of 0 to 100, with 0 being the worst observed value and 100 the best. The seven best performing countries are ranked in the table (copied from the site).
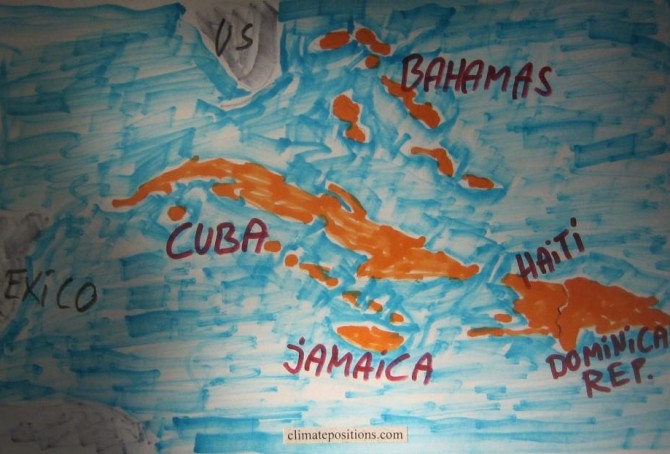
Climate change performance of Jamaica, Cuba, Haiti, the Dominican Republic and the Bahamas
2015
Jamaica’s updated Climate Debt per capita is $181 and the one of the Dominican Republic is $67. Cuba and Haiti are both Contribution Free (no Climate Debt). See the ‘ranking’ of 147 countries by November 2014. The Bahamas are not included due to lack of data on Ecological Footprint – however, if this indicator it is set at world’s average, then the per capita Climate Debt of the Bahamas would be $2,982 (ranked 17). The following examines CO2 Emissions from fossil fuels, GDP(ppp-$), Environmental Performance and Forest Cover.

Climate change performance of Austria, Czech Republic and Switzerland
2015
0.4% of the global population lives in Austria, Czech Republic or Switzerland and together they emitted 0.6% of the global CO2 from fossil fuels in 2012 – the joint share of the global Climate Debt is 0.7%. Austria’s updated Climate Debt per capita is $2,400 (ranked 19th), Czech Republic’s is $1,137 (ranked 34th) and Switzerland’s is $969 (ranked 38th). See the ‘ranking’. The following examines the Climate Debt trends and the indicators of CO2 Emissions (carbon dioxide from fossil fuels), Nuclear Power, Environmental Performance, GDP(ppp-$) and Climate Debt as a percentage of GDP(ppp-$).
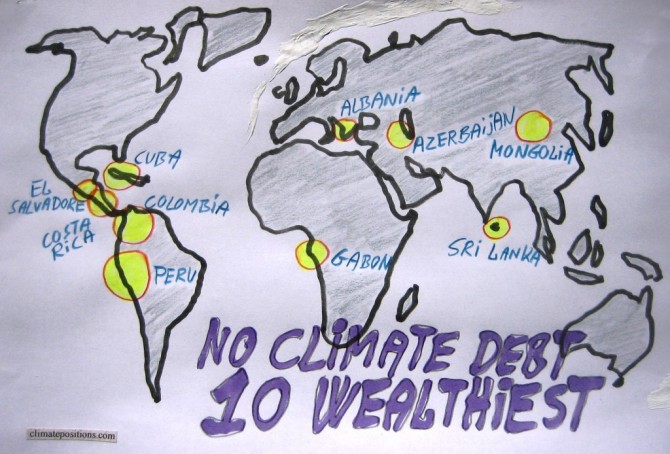
The ten wealthiest countries without any Climate Debt
2015
Among the 147 countries with full data in ClimatePositions 65 are Contribution Free (no Climate Debt). See the ‘ranking’. The table in this article ranks (from 1 to 10) the ten wealthiest Contribution Free countries by the following eight indicators:
- Per capita GDP(ppp-$) (1 = wealthiest)
- Income Equality (1 = most equal)
- Per capita CO2 Emissions from fossil fuels (1 = lowest emissions)
- Democracy Index (1 = most democracy)
- Environmental Performance (1 = best performance)
- Life Expectancy by birth (1 = longest lives)
- Per capita Ecological Footprint without carbon (1 = smallest footprint)
- Primary Forests as a percentage of the total land area (1 = largest percentage)
Read the comments below the table.
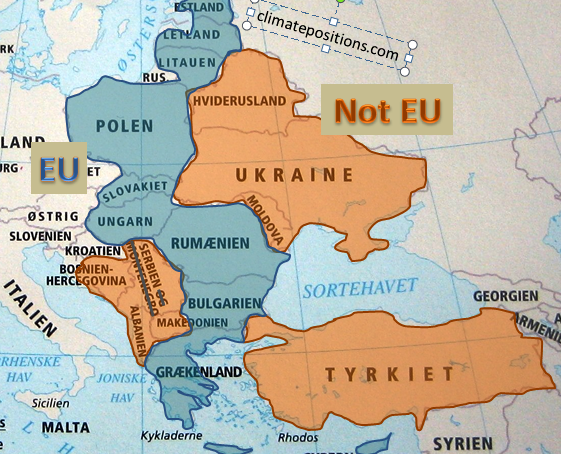
European Union “east” compared to bordering countries
2015
The ‘European Union’ (EU) is an economic and political partnership between ‘28 countries’. Around 7% of the global population lives in EU and they emit around 12% of the global CO2 from fossil fuels and are responsible of 13% of the Climate Debt in ClimatePositions. The following examines a group of 10 countries in eastern EU which joined the union between 1981 and 2007 in comparison with 8 bordering countries.

Climate change performance: Turkey vs. Egypt
2015
Turkey is ranked 57th and Egypt 71st among 147 countries on the list of the worst performing countries in ClimatePositions. See the ‘ranking’. The Turkish Climate Debt accumulated since 2000 increased from $161 per capita in 2010 to $324 in the latest calculation, while the one of Egypt increased from $40 to $73. The first diagram shows the relative Climate Debt of the two countries in comparison with Lebanon, Jordan and China, with the world average set at 100. Note that the world’s average Climate Debt increased from $455 per capita in 2010 to $769 in 2014 (reflecting the growing CO2 Emissions from fossil fuels and the growing economy). The following examines some indicators and trends of Turkey and Egypt.
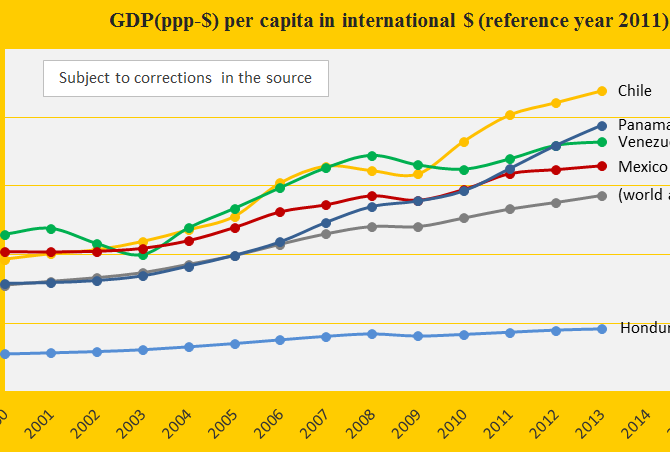
Climate change performance of Venezuela, Chile and Mexico
2015
Venezuela, Chile and Mexico are ranked 42nd, 44th and 58th among 147 countries on the worst performing list in ClimatePositions (see the ‘ranking’). Their updated Climate Contributions (climate debt) are respectively $697, $561 and $313 per capita. The first diagram shows the GDP(ppp-$) per capita of the three countries, in comparison with Panama, Honduras and the world average. Chile is the third wealthiest country in the America’s after (far after!) the United States and Canada – Honduras is the second poorest after Nicaragua.

65 Contribution Free countries…GDP-ranked (with Income Equality, Life Expectancy and Environmental Performance)
2014
65 out of 147 countries with full data in ClimatePositions are Contribution Free (no climate debt). 41% of the world’s population lives in these Contribution Free countries and they emitted only 9% of the global carbon dioxide from fossil fuels in 2012 – without India the corresponding figures are 24% of the global population and 3% of the emissions.
The table below shows the 65 Contribution Free countries ranked by GDP(ppp-$) per capita, with Income Equality (‘Atkinson Index‘), Life Expectancy and Environmental Performance. The world’s average GDP(ppp-$) per capita was $13.791 in 2012. Analysis and comments see below the table – the color codes are explained in the bottom.
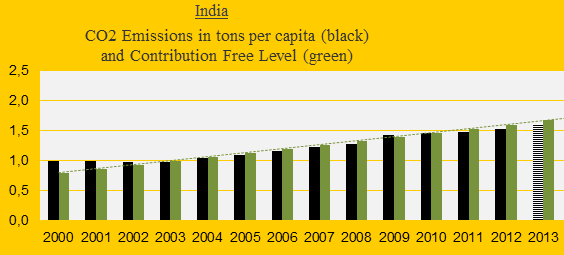
CO2 Emissions 2013: India is still Contribution Free (but how long?)
2014
India was the 3rd largest emitter of carbon dioxide in 2013 (preliminary estimate), but the per capita emissions were only about one-third of the world average. The first diagram shows India’s CO2 Emissions per capita 2000-2013 (2013-emissions are preliminary estimates). The green bars are the Contribution Free Level in ClimatePositions. As long as emissions remain below the free level, on average, the climate debt is zero dollars. However, India balances close to the limit.
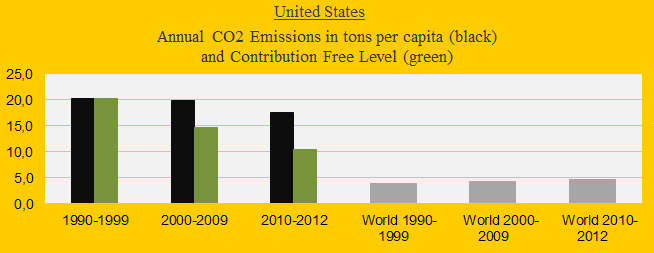
Climate change performance of the United States 2000-2013 (and the new emission target)
2014
Last week the United States ‘agreed’ with China to reduce US greenhouse gas emissions between 26% and 28% from the 2005-level by 2025. The agreement is legally non-binding and without the support of the Republicans. The following analyze the new US emission target (in the bottom) and the general performance in comparison with the spying buddies in Five Eyes Alliance¹: Canada, Australia, New Zealand and United Kingdom.
The United States is presently ranked 10th out of 147 countries in Climate Contribution (climate debt) per capita. See the ‘ranking’. The US ‘share of the global Climate Contributions’ is now 37.0%, compared to 40.7% in 2010. The first diagram shows the CO2 Emissions per capita in decades in comparison with the world average. The green bars are the Contribution Free Level, determined by the level of CO2 Emissions in the 1990s and the eleven ‘indicators’. The declining US share of the global climate debt is mainly due to reduced CO2 Emissions while the global emissions have increased.
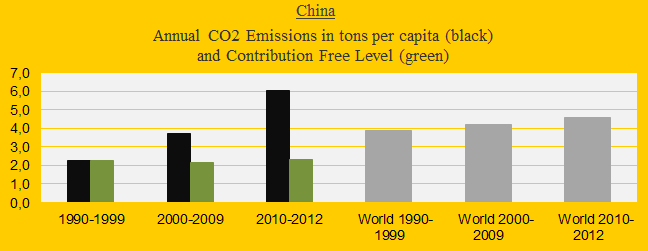
China’s growing climate debt and carbon dioxide emissions is catastrophic
2014
Today, China ‘agreed‘ with the United States (without the Republicans!?) that the Chinese CO2 Emissions can increase by 2030, after which emissions shall decrease. The agreement is legally non-binding and can almost be seen as a confirmation of the ‘worst case climate scenario‘. The first diagram shows the CO2 Emissions of China (the black bars) in decades in comparison with the world average (the grey bars). The green bars show the Chinese Contribution Free Levels in ClimatePositions. Today the Climate Contribution (climate debt) is $402 per capita and the ranking is 52nd out of 147 countries (see the ‘ranking’). The updated Chinese Climate Contribution is 10.3% of the global contribution, second only to the United States (see the ‘ranking’).