Climate performance of Mexico and neighboring countries
2014
The Mexican CO2 Emissions per capita over time are similar to the world trend (see the diagram) and Mexico is the world’s 12th largest CO2 emitter. Together with the neighboring countries Mexico represent the full range of Climate Contributions (climate debt) worldwide. The following examines the statistics of Mexico in comparison with United States, Guatemala, El Salvador and Honduras.
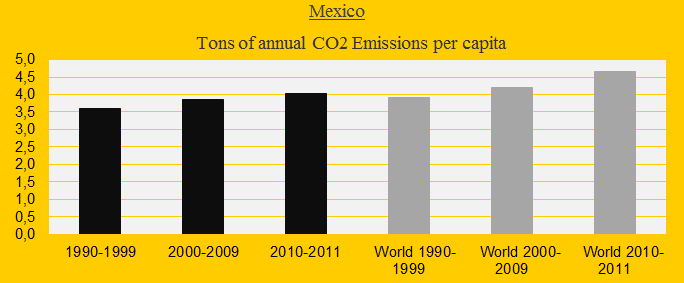
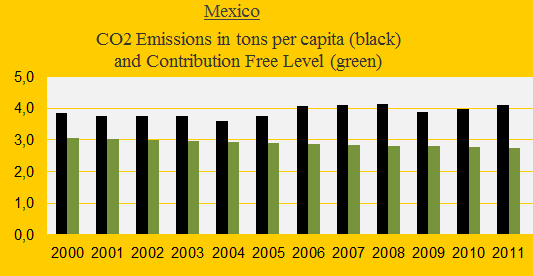
The Mexican CO2 Emissions were 4.1 tons per capita in 2011 (see the diagram below). United States, the big brother up north, emitted 17.6 tons and the southern neighbors Guatemala, Honduras and El Salvador emitted between 0.8 and 1.1 tons. The difference in emissions per capita is enormous.
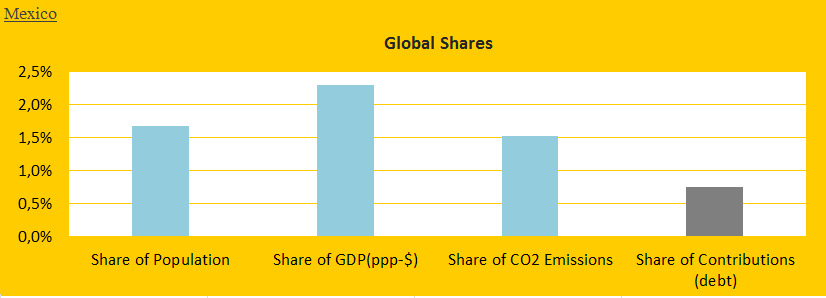
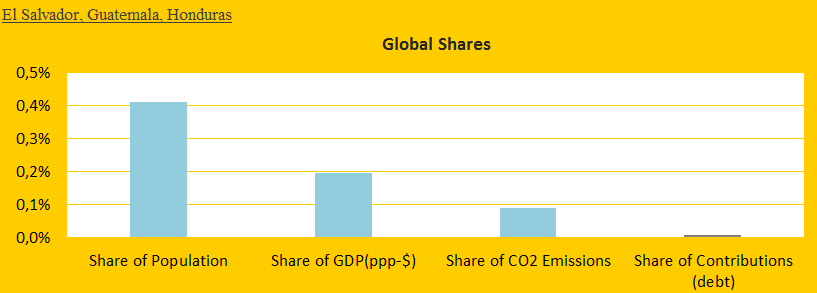
The three diagrams below emphases the imbalances in the region:
A) Mexico’s total share of the global: 1) Population (1.68%), 2) GDP(ppp-$) (2.29%), 3) CO2 Emissions (1.52%) and 4) Contribution (0.75%).
B) The same statistics of Honduras, Guatemala and El Salvador, seen as one group (the national trends are similar although only El Salvador is Contribution Free).
C) The same statistics of the United States.
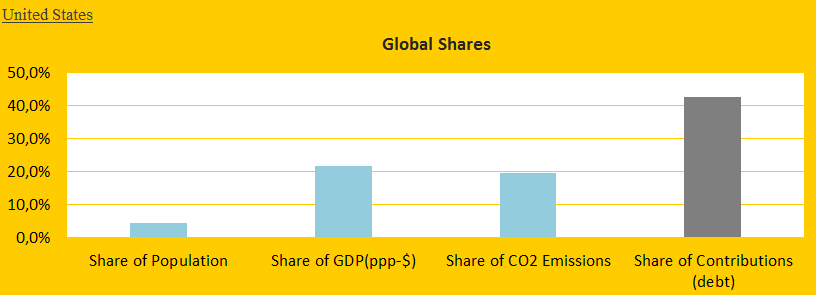
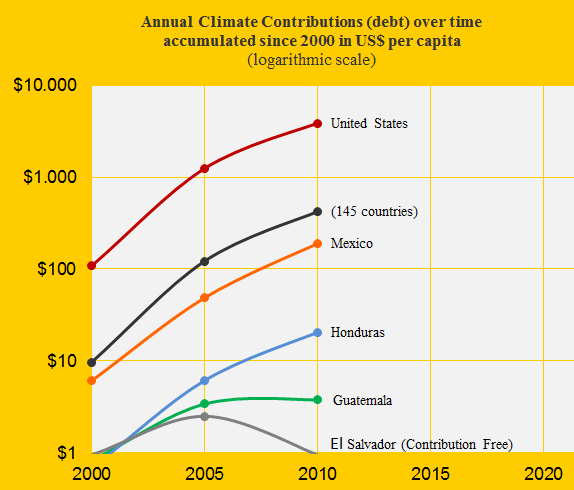
Looking solely at the Climate Contributions (climate debt) in 2010 the United States were ranked 7th, Mexico 52nd, Honduras 72nd, Guatemala 80th and El Salvador were Contribution Free. See the Contributions per capita over time in the diagram below (note the logarithmic scale). If Mexico, Honduras and Guatemala paid their Climate Contributions to a global climate fund the initial payment would be about $30 billion (and ideally include all 68 Contribution Free countries worldwide with 44% of the world population). The United States has ludicrously rejected a binding climate agreement at the COP-summits and stated that climate financing must take place in an investment marked motivated by profit. The United States is held responsible for 43% of the global Climate Contributions (climate debt) in ClimatePositions 2010. The calculation method is identical for all 145 countries included and new indicator data is continuously entered (see the updated Climate Contributions in the menu “Calculations/Per Capita US$ Rank”).
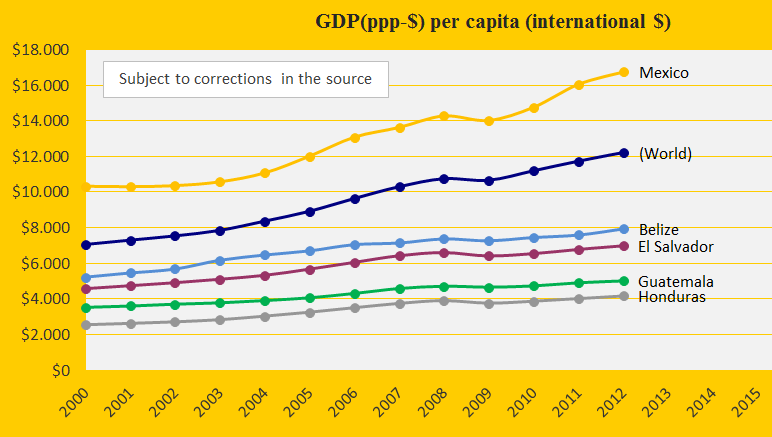
The last diagram shows the development in GDP(ppp $) for Mexico and the southern neighbors. The GDP of United States is three times larger than Mexico’s. The CO2 Emissions in tons per capita were as follows in 2011: United States 17.6, Mexico 4.1, Belize 1.7, El Salvador 1.1, Guatemala 0.8 and Honduras 1.0. The correlation between national GDP (wealth) and CO2 Emissions (responsibility for the climate change) is beyond doubt.
A hypothetical example: If the Mexican CO2 Emissions had remained at the level in the 1990s, when the Ecological Footprint was approximately the same as the world average, and the Environmental Performance was as good as in Costa Rica, and the forest area had remained at the level in 1990, and the insignificant Nuclear Power generation were closed down – then the updated Mexican Climate Contribution accumulated since 2000 would have been $13 billion instead of the present $29 billion.
In 2012, Mexico passed a comprehensive climate change bill that has set a goal for the country to generate 35% of its energy from clean energy sources by 2024, and to cut emissions by 50% by 2050, from the level in 2000. The country has the world’s 3rd largest solar energy potential. In 1980 oil exports accounted for 61.6% of total exports; by 2000 it was only 7.3% (source: Wikipedia). Today Mexico is the 9th largest oil producer in the world.
Mexico is one of the 18 megadiverse countries of the world with more than 200,000 different species and ranks 4th in overall species. Mexico is considered home of 10–12% of the world’s biodiversity (source: Wikipedia).
Information on national GDP(ppp-$) per capita: Worldbank (links in the menu “Calculations”).
Source on CO2 Emissions: EIA, U.S. Energy Information Administration (links in the menu “Calculations”).
Data on national and global Populations: EIA, U.S. Energy Information Administration (links in the menu “Calculations”).
Comments are closed.