Guatemala is close to being Contribution Free
2013
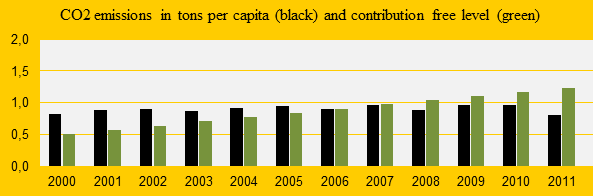
Guatemala was the 82nd worst performing country out of 145 full data countries in ClimatePositions 2010. The national Contribution (climate debt) was $4 per capita, but in the latest calculation this amount is cut in half thanks to decreasing CO2 Emissions (carbon dioxide) in 2011 (see the front diagram). In a few months Guatemala may be Contribution Free.
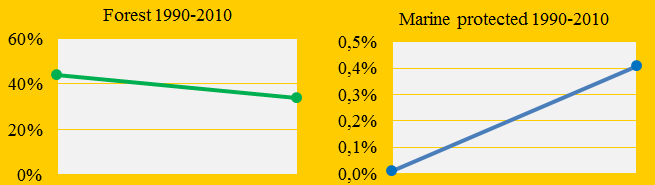
As shown in the diagram below, Guatemala has a serios problem with the cutting of rainforest. Since 1990 the proportion of the land area has been reduced from 44% to 34%. As a likely future member of the Contributions Free countries, Guatemala would be a prime candidate for forest conservation funds from a global fund – if the disorientated world community established one. Note that Guatemala has increased the marine protected areas from 0.0% of the total sea in 1990 to 0.4% in 2010.
The diagram below is from ClimatePositions 2010 and show the Guatemalan share of the global: 1) Population (0.20%), 2) GDP(ppp-$) (0.09%), 3) CO2 Emission (2006-2010) (0.04%) and 4) Contribution (0.00%). A policy objective of sustainable development could be to raise the national GDP(ppp-$) while the Contribution remains at (drops to) zero dollars.

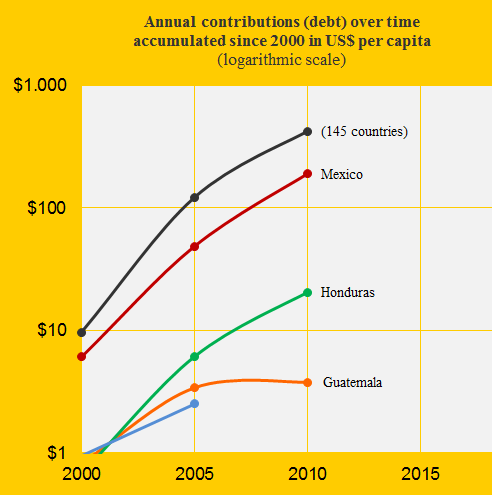
The diagram below shows the Guatemalan Contribution over time compared to the neighboring countries Mexico, Honduras, and El Salvador (the blue line). The latter country was Contribution Free in 2010. The black line is the global average. Note the logarithmic scale.
Source on CO2 emissions: EIA, U.S. Energy Information Administration (links in the menu “Calculations”).
Data sources on national forest area are from the United Nations (UN)(links in the menu “Calculations”).
Data sources on national marine area protected are from the United Nations (UN)(links in the menu “Calculations”).
Information on national GDP(ppp-$) per capita is from Worldbank (links in the menu “Calculations”). Read about GDP+ in the submenu ”Indicators”.
Data on national and global populations are from the EIA, U.S. Energy Information Administration. Global population before 1980 is from United Nations (UN) (links in the menu “Calculations”).
Comments are closed.