About calculation of national climate contributions

2013
The calculations in ClimatePositions are complex and yet the same for all countries. The progressive national indicator updates since 2000 ensure that the countries multifaceted performances are reflected directly in the Climate Contributions (climate debt). The front image shows the main calculation spreadsheet (Excel) in ClimatePositions. All updated indicator values are entered the spreadsheet and by copying a country from the country list (with all the numerical values) and insert in the country box (cell A30) – all calculations are done automatically and the national Contribution per capita appears (cell B20).
The different indicators are updated at different times and the final (complete) update is available every five years and the next will be ClimatePositions 2015 with the expected publication two years later. Update status are available in the spreadsheets first sheet “updates” – see the image below. In the latest version of ClimatePositions (2010-2012 M) are still missing national 2012 updates on CO2 Emissions (carbon dioxide), Population, Environmental Performance and Ecological Footprint.
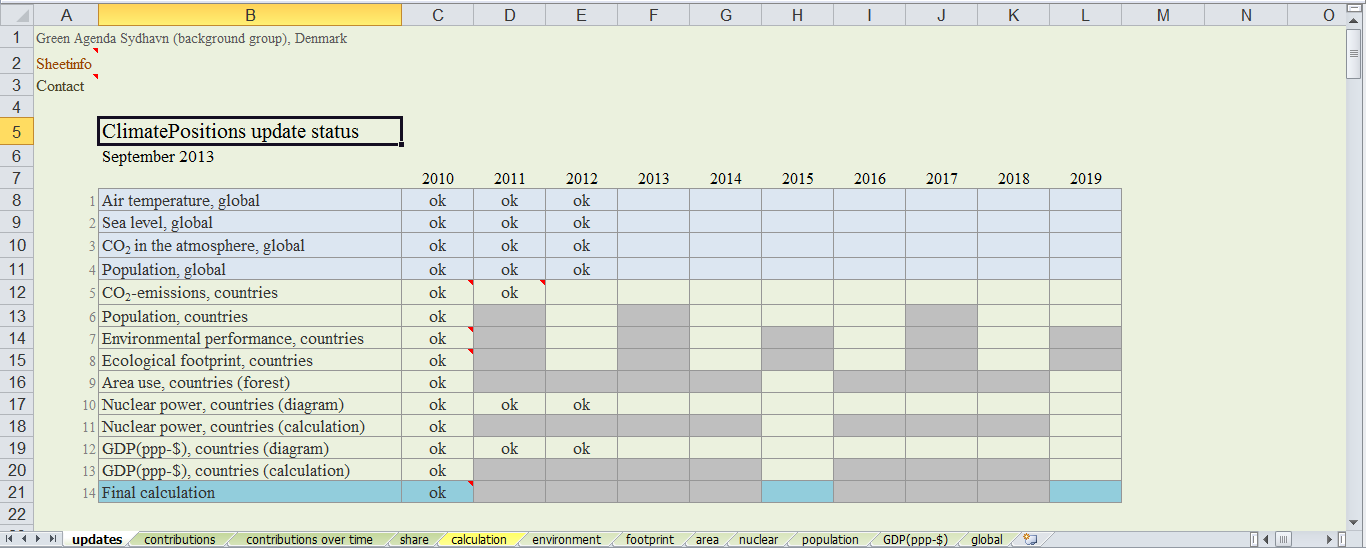
The spreadsheet contains these twelve sheets:
- updates (status)
- contributions (2010)
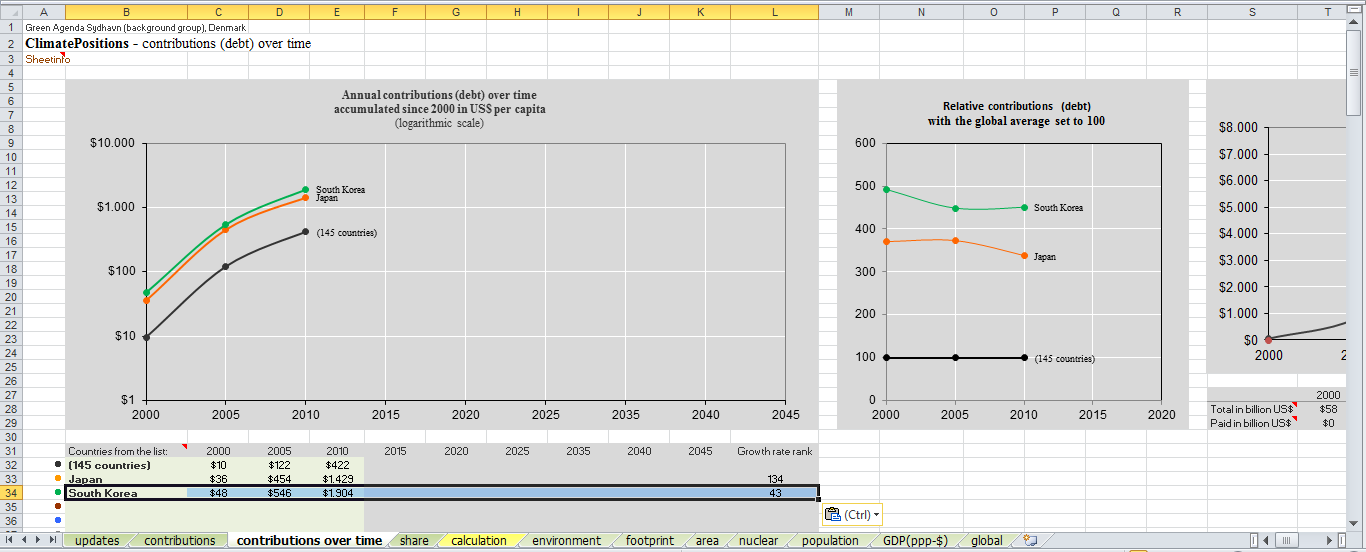
- contributions over time (2000, 2005 and 2010)
- share (percent of the Global Population, GDP(ppp-$), CO2 Emissions and Climate Contributions)
- calculation (the updated calculation sheet)
- environment (Environmantal Performance)
- footprint (Ecological Footprint without CO2 Emissions)
- area (forest area and marine protected areas)
- nuclear (power generation)
- population (national)
- GDP(ppp-$)
- global (CO2 Content in the atmosphere, Air Temperature, Population and Sea Level)
Each of the twelve sheets has its own setup and below is an example with the sheet “contributions over time”. Japan and South Korea are copied from the country list and inserted in the country box to compare. The total global Climate Contributions 2000, 2005 and 2010 are also shown in the sheet (the diagram to the right).
Read more about the indicators in the menu “Calculations/Indicators”. See the ranking of the worst performing countries (in 2010) in the menu “Contributions/Per Capita US$ Rank”.
In addition to the 145 countries with full data in ClimatePositions are 54 countries with incomplete data (without estimated Contributions). More about these countries soon.
Comments are closed.