Fossil CO2 Emissions: European Union, United States and China (Per capita and Total)
/2025/ The graphs below show the Fossil CO2 Emissions in tons Per capita from EU-27 in comparison to the United States, China and global emissions. Chinese emissions Per capita exceeded the global average around 2004 and EU-27 around 2011.
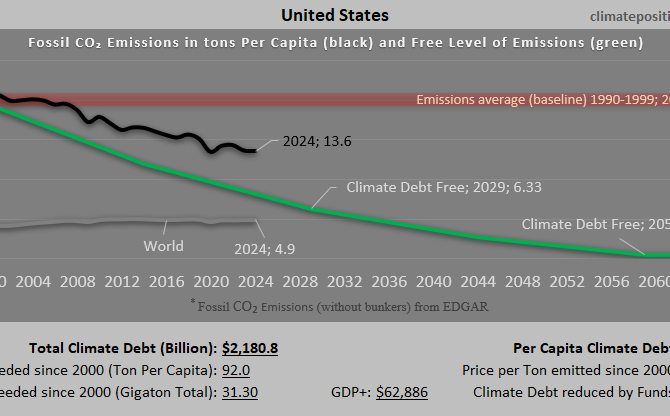
Climate Debt of United States 2025: $2181 Billion or 23.5% of the Global Climate Debt (or $6412 Per Capita)
/2025/ United States ranks 11th in Climate Debt Per Capita accumulated 2000-2025. Below are some key figures in the calculations. The diagram above shows the Fossil CO2 Emissions Per Capita and the Free Level of emissions (green). The wide straight red line shows emissions in the 1990s (baseline in the calculations).
United States: Per Capita Climate Debt $6,870 (Ranked 8) – Fossil CO2 Emissions
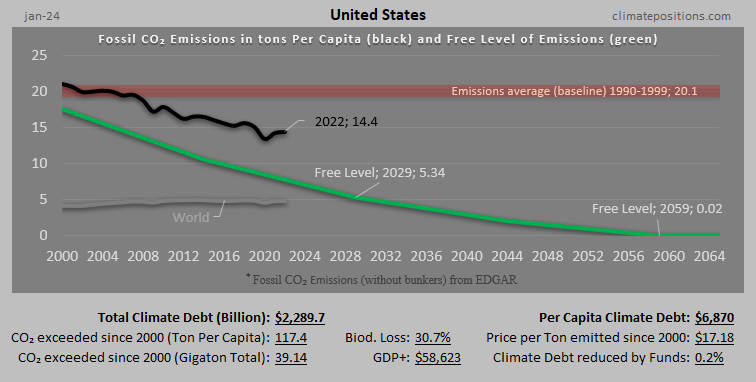
In 2024, United States is responsible for 29.26% of the Global Climate Debt accumulated since 2000. Below are some key figures in the calculations.
2024: Ranking updates now available (Global Climate Debt increases by 1.4 trillion dollars in two years)
/2024/ A new version of ClimatePositions Calculation Excel is now available in the menu. Updated rankings by country are also available in the menus.
In January 2024, the Global Climate Debt (accumulated since 2000) was 7.8 Trillion dollars, which is an increase of 700 Billion dollars annually since 2022. This reflects the tragic fact that global CO2 Emissions from Fossil Fuels were 6.7% higher in 2022 than in 2020.

Canada – per capita Fossil CO2 Emissions and Climate Debt
2020
Canada’s current Climate Breakdown Pricing amounts to $29.84 per tons Fossil CO2 emitted since 2000. The Climate Debt grew from $6,452 per capita in 2015 to $9,685 in 2020. Updated Rankings of 165 countries are available in the menu “Climate Debt”.
The following diagrams expose the trends of Fossil CO2 Emissions, Climate Debt, GDP(ppp-$), Nuclear Power and Ecological Footprint without carbon.

Saudi Arabia – per capita Fossil CO2 Emissions and Climate Debt
2020
Saudi Arabia’s current Climate Breakdown Pricing amounts to $45.11 per tons Fossil CO2 emitted since 2000. The Climate Debt grew from $5,683 per capita in 2015 to $13,955 in 2020. Updated Rankings of 165 countries are available in the menu “Climate Debt”.
The following diagrams expose the trends of Fossil CO2 Emissions, Climate Debt, GDP(ppp-$) and Ecological Footprint without carbon.

South Korea – per capita Fossil CO2 Emissions and Climate Debt
2020
South Korea’s current Climate Breakdown Pricing amounts to $33.53 per tons Fossil CO2 emitted since 2000. The Climate Debt grew from $3,608 per capita in 2015 to $7,397 in 2020. Updated Rankings of 165 countries are available in the menu “Climate Debt”.
The following diagrams expose the trends of Fossil CO2 Emissions, Climate Debt, GDP(ppp-$) and Ecological Footprint without carbon.

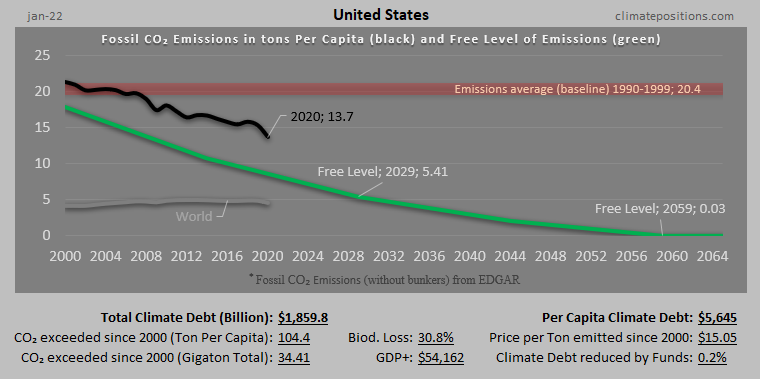
United States – per capita Fossil CO2 Emissions and Climate Debt
2020
The current Climate Breakdown Pricing of the United States amounts to $30.82 per tons Fossil CO2 emitted since 2000. The Climate Debt grew from $5,497 per capita in 2015 to $10,718 in 2020. Updated Rankings of 165 countries are available in the menu “Climate Debt”.
The following diagrams expose the trends of Fossil CO2 Emissions, Climate Debt, GDP(ppp-$) and Nuclear Power.
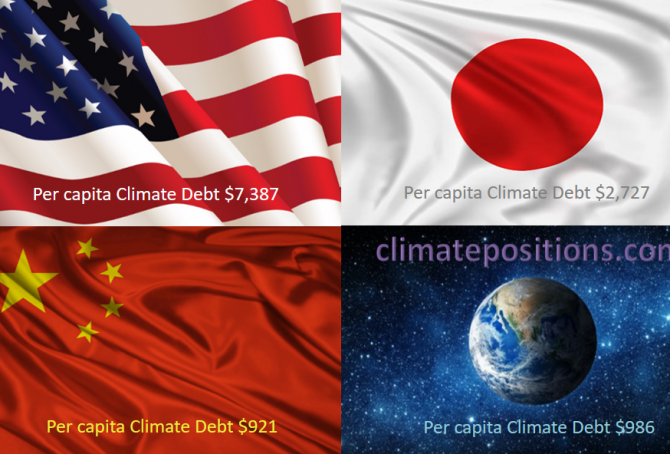
Share of global Climate Debt rank 1st, 2nd and 3rd: The United States, China and Japan (combined responsible for 55% of Climate Debt and 47% of Fossil CO2 Emissions 2016)
2017
The diagram below shows ‘Share of global Climate Debt‘ in 2010, 2015 and 2017 of the United States, Japan and China (ranked 1st, 2nd and 3rd). The shares of the United States and Japan are decreasing at slower rates lately, whereas China’s is increasing fast. Global Climate Debt accumulated since 2000 is $7.2 Trillion.
Updated Climate Debt of 163 countries (per capita Fossil CO2 Emissions 1990-2016)
2017
National per capita CO2 Emissions from Fossil Fuels (without bunkers) and industrial processes in 2016 have been released by ‘EDGAR‘. At the same time, recalculated historic emissions have been released, which for some countries make a considerable difference¹ (also with regard to Climate Debt in ClimatePositions). The updated calculations are available in ‘Calculation (Excel)‘, and new rankings of 163 countries are available in the menu “Climate Debt”.
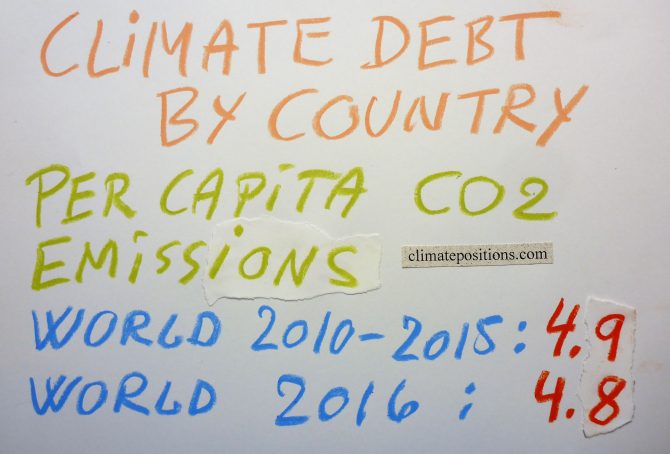
The table below shows World average, and the 15 countries with the largest per capita CO2 Emissions from Fossil Fuels and industrial processes in 2016, in tons, in comparison with average emissions 1990-1999, 2000-2009 and 2010-2015.

Global Carbon Project (CDIAC), located in the United States, stops publishing carbon emissions data by country – will be replaced by EDGAR in ClimatePositions
2017
The Carbon Dioxide Information Analysis Center (CDIAC), located at the U.S. Department of Energy’s (DOE) Oak Ridge National Laboratory, has published annual Carbon Emissions from Fossil Fuels and cement production by country since 1959 (‘Global Carbon Project‘), but now this continuous time series has come to an end and 2015 will be the last data-year (as it seems).
Since carbon emissions data from CDIAC (Global Carbon Project) is the core ‘Indicator‘ in ClimatePositions’ calculation of Climate Debt, carbon emissions data will be replaced with nearly similar data from ‘EDGAR‘ (‘European Commission‘ / ‘Climate Action‘), retroactively since 1990, in connection with the coming updates [done 16-08-2017].
The following describes the differences between CO2 Emissions data from Global Carbon Project (CDIAC) and EDGAR (sourced: European Commission, Joint Research Centre (JRC)/Netherlands Environmental Assessment Agency (PBL). Emission Database for Global Atmospheric Research (EDGAR)), and the consequences in terms of Climate Debt in ClimatePositions – illustrated with a range of country examples. Note that other sources, such as ‘IEA‘, ‘EIA‘ and ‘BP‘, provides CO2 Emissions data-sets different from the ones of CDIAC and EDGAR.
World CO2 Emissions 2000-2059: with 50% risk of 2C global warming (two per capita emission-scenarios for the United States, Denmark, Spain, China, India and Nigeria)
2017
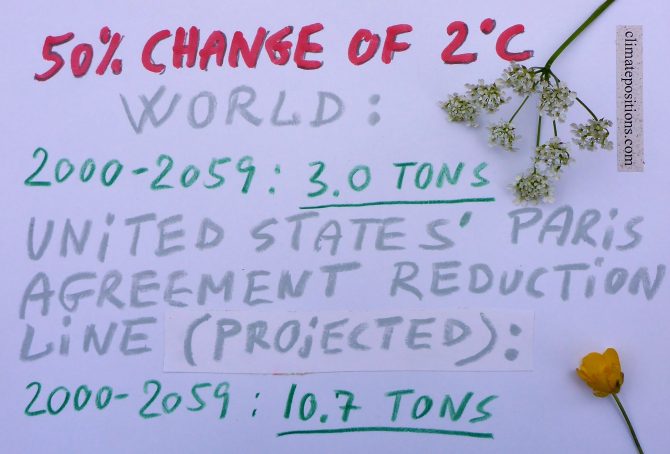
In continuation of the previous article ‘Carbon Brief: Global Carbon Budget and CO2 Emission scenarios (50% risk of 1.5°C, 2.0°C and 3.0°C warming)‘, the following examines the per capita CO2 Emission budget 2000-2059, with a 50% risk of 2°C global warming (which of course is unacceptable). The outcome is then compared with Climate Debt Free CO2 Emission levels (in ClimatePositions) of the United States, Denmark, Spain, China, India and Nigeria, during the same 60-year period. Also, the Paris Agreements reduction commitment of the United States is put into perspective.
My own climate change boycott country-list
2017
Without been fanatical about it, I seek to boycott the greediest and most climate-destructive countries on the planet. For the fairness, I have divided the fifteen nominees into two leagues:
A) Countries with per capita Climate Debts more than 10 times world average: Qatar, Kuwait, Brunei, Luxembourg, Trinidad and Tobago, United Arab Emirates and Oman.
B) Countries with per capita Climate Debts between 5 and 10 times world average: Saudi Arabia, United States, Bahrain, Australia, Norway, Equatorial Guinea, Canada and South Korea.
Feel free to copy…
Among the fifteen countries only Luxembourg and South Korea are not among the world’s twenty largest per capita Fossil Fuel producers (read the article: ‘How green are the fossil fuel producers? (Correlation between fossil fuel production, CO2 Emissions, GDP and Climate Debt)‘.
The table below shows some key data of the fifteen countries. The table is read like this: 1) Between 1990 and 1999 Qatar emitted 55.1 tons of CO2 from Fossil Fuels (without bunker) and cement, annually per capita, 2) Between 2000 and 2015 Qatar emitted 51.7 tons (the average Climate Debt Free Level¹ was 32.4 tons), and 3) Qatars GDP(ppp) per capita was $143,788 in 2015.
Climate change performance: Canada vs. South Africa
2017
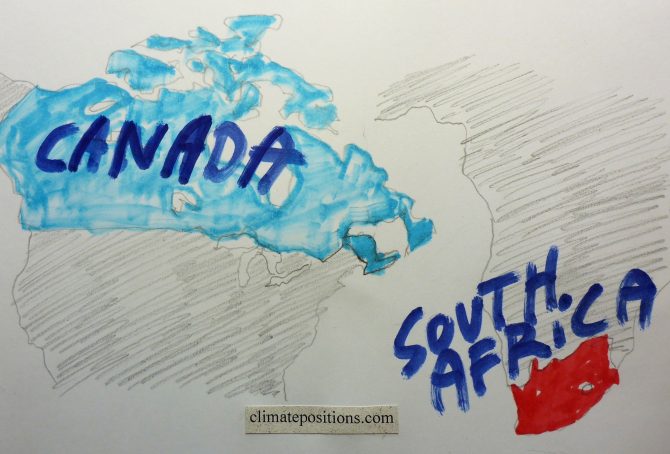
Canada and South Africa are the world’s 13th and 14th largest emitters of CO2 from Fossil Fuels and cement. Combined, the two countries were responsible for 2.6% of world CO2 Emissions in 2015. The following examines the ‘Indicators‘ of CO2 Emissions, GDP(ppp-$), Ecological Footprint and Nuclear Power.
The diagrams below show the per capita CO2 Emissions from Fossil Fuel (without bunkers) and cement, since 2000. The green bars show the Free Emission Level¹ – the exceedance is the basis for calculating the national Climate Debt. Canada’s emissions from coal decreased by 41.3% between 2000 and 2014 (coal caused 13% of the CO2 Emissions from Fossil Fuels in 2014). South Africa’s emissions from coal increased by 6.4% between 2010 and 2014 (coal caused 83% of the CO2 Emissions from Fossil Fuels in 2014).
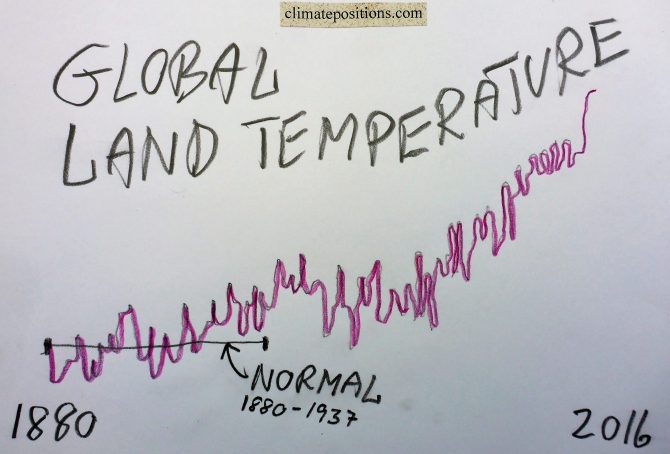
Global Indicator Update: Land Temperature 2016 (warmest year on record)
2017
The year 2016 was by far the hottest on planet Earth since measurements began in 1880. Both global Land (air) Temperature and Ocean (air) Temperature were the hottest on record. See the development in Land Temperature between 1960 and 2016 in the diagram below. The average temperature rise 1880-1937 is set at 0°C (baseline 1880-1937) and 2016 was 1.73°C warmer. The development since 1880 in Land Temperature and Ocean Temperature (and the two combined) are available at ‘ncdc.noaa.gov‘.
Added 22-01-17: The Ocean Temperature 2016 was 0.94°C warmer compared to baseline 1880-1937, and Land and Ocean Temperature combined was 1.15°C warmer. Note that other sources may refer to baseline 1881-1910 or even 1951-1980.
Added 07-02-2017: Soon, the global temperature ‘Indicator’ in ClimatePosition will be changed from Land (air) Temperature (10-years average) to Land/Ocean (air) Temperature (10-years average). The change will not affect the current accumulated Climate Debt of any country, only the future calculation.
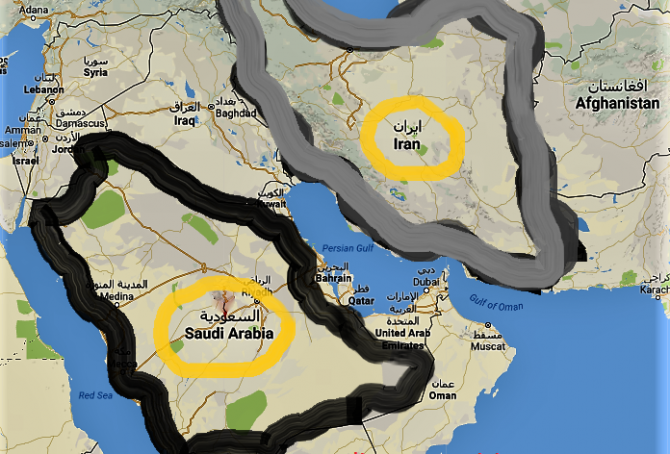
Climate change performance: Iran vs. Saudi Arabia (gas and oil)
2016
The large oil and gas producers Iran and Saudi Arabia are the world´s 7th and 8th largest emitters of CO2 from Fossil Fuels. The diagrams below show the per capita CO2 Emissions from Fossil Fuels (without bunkers) and cement, annually since 2000. The green bars show the Free Emission Level¹ – the exceedance is the basis for calculating the national Climate Debt. Iran and Saudi Arabia were responsible for 1.9% and 1.7% of global emissions in 2015.

Climate change performance: China vs. the United States (wealth inequality)
2016
The diagrams below show the per capita CO2 Emissions from Fossil Fuel (without bunkers) and cement, annually since 2000, of China and the United States. The green bars show the Free Emission Level¹ – the exceedance is the basis for calculating the national Climate Debt. The world’s two largest CO2-emitters were responsible for 29% (China) and 15% of global emissions in 2015.
Apparently, China’s per capita emissions have peaked, while the moderate reduction-rate 2006-2012 of the United States, has flattened out.

Climate change lawsuit against the government of the United States (Our Children’s Trust)
2016
November 10, 2016, twenty-one youth from the United States, age 9 to 20, were legally permitted to file a landmark constitutional climate change lawsuit against the federal government in the U.S. District Court for the District of Oregon. With support from ‘Our Children’s Trust‘, the youth’s complaint asserts that, through the governments affirmative actions in causing climate change, it has violated the youngest generation’s constitutional rights to life, liberty, property, as well as failed to protect essential public trust resources.

Final Update 2015: new rankings of 159 countries’ Climate Debt, accumulated since 2000
2016
Every five year, since 2005, Final Updates of national Climate Debts are completed in ClimatePositions and 2015-updates¹ are now available in ‘Calculation (Excel)‘. New rankings in six categories, of 159 countries, are available in the menu “Climate Debt”. In the coming months, the climate change performances of selected countries will be analyzed in articles, starting with the United States and China.
The following illustrate Final Update 2015 in two ways: 1) The change of Climate Debt as percentage of the global Climate Debt, annually since 2000, of the 10 largest CO2 emitters, and 2) Key-figures of the United States.
The table below of the 10 largest CO2 emitters (representing 70% of the global emissions in 2015) shows the national shares of the global Climate Debt in 2015 and 2010. China, Russia and Saudi Arabia stand out with extremely harmful developments, while the United States still has by far the largest Climate Debt. See the latest ‘Ranking’ of 159 countries.