Study: National climate pledges and the resulting Global Warming by 2100 (The Pledged Warming Map)
2018
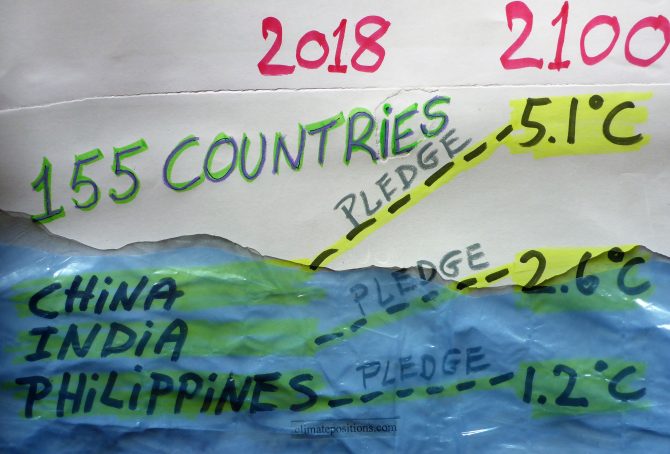
The Paris Agreement collectively committed the countries to limit Global Warming to well below 2°C and pursue efforts to limit warming to 1.5°C above preindustrial levels. However, how much Global Warming by 2100 is each country’s climate pledge leading to, if all countries adopted the same national approach and ambition? This question is being tried answered for the world’s countries on the new website ‘paris-equity-check.org‘ (Pledged Warming Map). The underlying ‘Peer-reviewed study‘ is published November 2018 in Nature Communications.
The site says: “The Paris Agreement includes bottom-up pledges and a top-down warming threshold. Under this setting where countries effectively choose their own fairness principle, Paris-Equity-Check.org presents scientifically peer-reviewed assessments the ambition of countries’ climate pledges (the Nationally Determined Contributions or NDCs) and address the question: What is a fair and ambitious contribution to achieving the Paris Agreement?” Read ‘Ambition of pledges‘ and ‘The science‘.
The table below shows 155 countries’ 1) ‘Per capita Climate Debt‘ in 2017, accumulated since 2000 in ClimatePositions, 2) per capita Fossil CO2 Emissions 2016, and 3) the pledges estimated effect on Global Warming by 2100 (Pledged Warming Map).
IPCC Report: Limiting Global Warming to 1.5ºC requires 45% CO2 reductions by 2030 compared to 2010 – and zero emissions by 2050 (but which countries are to reduce how much per capita?)
2018
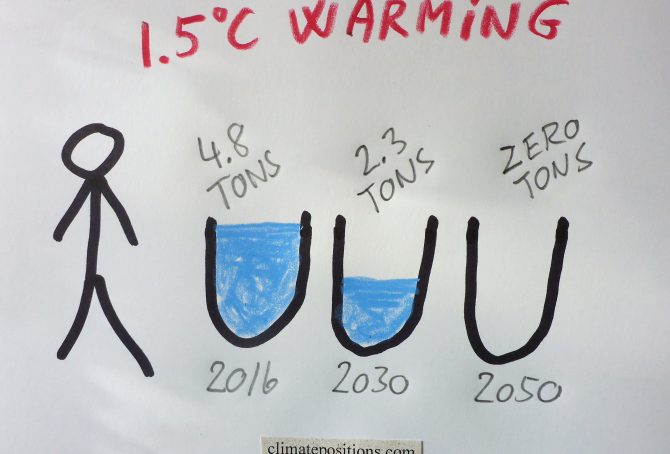
The IPCC Report ‘Global Warming of 1.5°C‘ released October 2018, finds that limiting global warming to 1.5°C would require reductions of global human-caused CO2 Emissions (carbon dioxide) of 45% by 2030 compared to 2010, and reach zero emissions around 2050¹.
However, since global Fossil CO2 Emissions increased 6.4% between 2010 and 2016, and the world population is expected to grow 1.2% annually the years to come, the required 45% global CO2 reductions by 2030, is equivalent to 53% reduction per capita by 2030 compared to 2016, or in only 14 years. In other words, an average world citizen must cut Fossil CO2 Emissions from 4.8 tons in 2016 to around 2.3 tons by 2030 and zero by 2050 (if limiting global warming to 1.5°C). Note that forest cover growth, removing CO2 from the air, etc. can substitute Fossil CO2 reductions in the IPCC scenarios².
World CO2 Emissions 2000-2059: with 50% risk of 2C global warming (two per capita emission-scenarios for the United States, Denmark, Spain, China, India and Nigeria)
2017
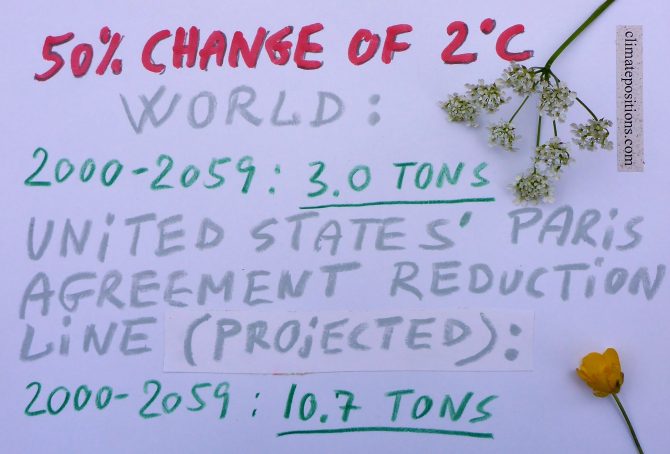
In continuation of the previous article ‘Carbon Brief: Global Carbon Budget and CO2 Emission scenarios (50% risk of 1.5°C, 2.0°C and 3.0°C warming)‘, the following examines the per capita CO2 Emission budget 2000-2059, with a 50% risk of 2°C global warming (which of course is unacceptable). The outcome is then compared with Climate Debt Free CO2 Emission levels (in ClimatePositions) of the United States, Denmark, Spain, China, India and Nigeria, during the same 60-year period. Also, the Paris Agreements reduction commitment of the United States is put into perspective.
The COP21 Paris Agreement: Diplomatic triumph, self-applause … and the carbon budget
2015
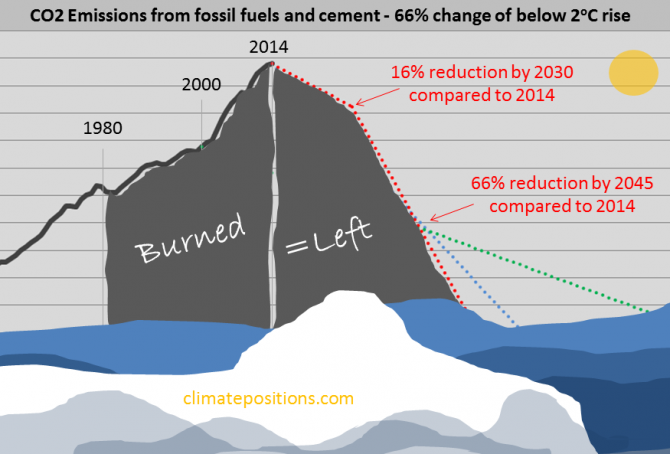
The COP21 ‘Paris Agreement’ (31 p), backed by 196 countries, emphasizes the urgent need to address the greenhouse gas emission gap between the aggregate effect of the 187 intended nationally defined contributions (INDCs/pledges) and the “aggregate emission pathways consistent with holding the increase in the global average temperature to well below 2°C above preindustrial levels and pursuing efforts to limit the temperature increase to 1.5°C”. This feverish understatement about the emission gab is clarified in the ‘Synthesis report (UN)’ on the aggregate effect of the pledges. The report says that the aggregate effect of the submitted pledges (INDCs) will bring the global cumulative CO2 Emissions up to around 72%–77% of the remaining carbon budget by 2030 (emitting 100% will leave the planet with 66% change of a temperature rise of less than 2°C). In other words: If the pledges are fulfilled perfectly, then three quarters of the remaining carbon budget will be used within 15 years … and thereafter emissions will have to dive deeply to zero before 2040. The critical situation is envisioned graphically below.
Update: Climate funding as share of Climate Debt, by country
2015
‘Climate Funds Update’ is an independent website providing information on climate finance designed for developing countries to address climate change. The data is based on information received from 25 multilateral, bilateral, regional and national climate funds and the funding is largely up to date by the end of June 2015. A total of $17 billion has currently been funded (money deposited), of which 96% is country-sourced¹. The updated table below shows the level of national climate financing to developing countries, as percentage of the accumulated Climate Debt. The values are based on the latest available updates.
New at COP21: The Vulnerable Twenty Group (V20)
2015
Prior to COP21 in Paris in December twenty countries most at risk from the effects of global warming has formed ‘The Vulnerable Twenty Group (V20)’. Unified, the new group hopes for greater access to climate finance for adaptation and mitigation. The twenty countries representing almost one-tenth of the world’s population are: Bangladesh, Philippines, Ethiopia, Vietnam, Tanzania, Kenya, Afghanistan, Nepal, Ghana, Madagascar, Rwanda, Costa Rica, Bhutan, Timor-Leste, Maldives, Barbados, Vanuatu, Saint Lucia, Kiribati and Tuvalu. The first thirteen on the list have full data in ClimatePositions and they are all Contribution Free (no Climate Debt) among 147 countries (see the ‘ranking’). The last seven are examined below in terms of climate change performance.
Giving up on future generations is real (about COP Submissions 2015)
2015
COP Submissions with intended national emission targets of 44 countries¹, responsible for 70% of the global CO2 Emissions from fossil fuels, are now available for study. Among the seven largest emitters only India’s submission is still missing. China, the world’s largest emitter, intends to reach its maximum emissions by 2030 (maybe earlier) and then reduce … which leaves global scenarios open to assumptions. The calculations in this article are based on 10% and 30% increase of the Chinese emissions by 2030, compared to 2013.
Greenhouse gas emissions and COP negotiation strategies
2015
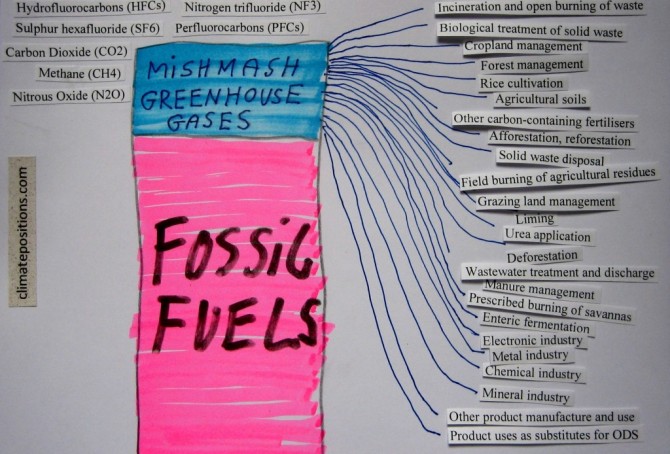
This article is about the different greenhouse gases and what appears to be a delaying COP negotiation strategy on the road to a potentially very costly global greenhouse gas reduction agreement. The essential climate change problem (as I see it) is the greenhouse gas emissions related to fossil fuels. As an example, around 82% of all anthropologic greenhouse gases in the United States are related to coal, oil or natural gas. This measure includes emissions of three different greenhouse gases: carbon dioxide (CO2), methane (CH4) and nitrous oxide (N2O).
Since 1990 the atmospheric concentrations of these three gases has increases by around 13% (carbon dioxide), 7% (methane) and 6% (nitrous oxide). However, the three gases are also emitted from other sources than fossil fuels, including many natural sources … in addition, the potent synthetic fluorinated gases (F-gases) are not related to fossil fuels at all. On a global scale the overall picture is extremely complicated. Note that water vapor is the dominant greenhouse gas among all, but it is not considered relevant to the anthropogenic global warming – and therefore water vapor is usually not regarded as a greenhouse gas.
Oslo Principles on obligations to reduce climate change (time for legal sanctions)
2015
March 2015, a group of prominent experts¹ in international law, human rights law, environmental law, and other law adopted the ‘Oslo Principles on Global Obligations to Reduce Climate Change’ (pdf 8 pages) – see also the expert group’s appended ‘Commentary’ (pdf 94 pages; this ‘List of contents’ written by me might be useful).
Before proceeding read this summarizing article on the subject in The Guardian: ‘Climate change: at last a breakthrough to our catastrophic political impasse?’ and this article in Huffington Post: ‘Landmark Dutch Lawsuit Puts Governments Around the World on Notice’.
The Oslo Principles are divided into a Preamble (introduction), a General Principle (Principle 1), Definitions (Principles 2-5) and Specific Obligations (A. Obligations of States and Enterprises, Principles 6-12; B. Obligations of States, Principles 13-24; C. Procedural Obligations of States, Principles 25-26 and D. Obligations of Enterprises, Principles 27-30).
In short, the message is that ‘greenhouse gas’ emissions (GHG emissions) are unlawful unless they are consistent with a plan of steady reductions to ensure that the global surface temperature increase never exceeds pre-industrial temperatures by more than two degrees Celsius – in accordance with the recommendations of an overwhelming majority of leading climate scientists.
Below is a selection of essential selected quotes from the Oslo Principles (in red) and the appended Commentaries (in blue).
COP20 in Lima: Derailed negotiations and depressed scientists
2014
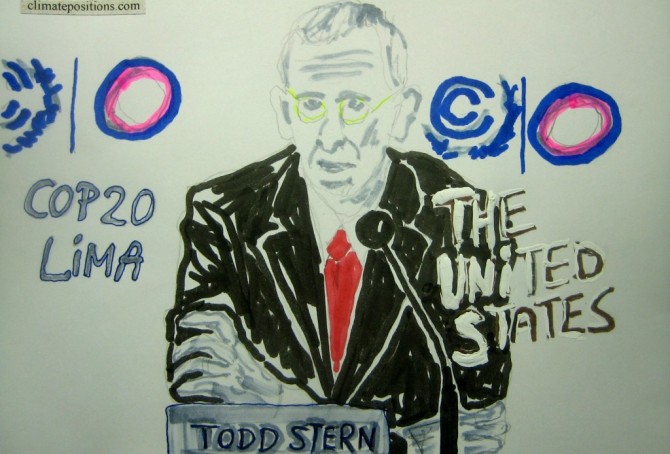
Since ‘COP1 in Berlin’ in 1995 the global CO2 Emissions from fossil fuels have increased by 50% (in addition to increased greenhouse gas emissions from deforestation, cement production, melting permafrost, etc.). The purpose of COP1, COP2, COP3, COP4, COP5, COP6, COP7, COP8, COP9, COP10, COP11, COP12, COP13, COP14, COP15, COP16, COP17, COP18 and COP19 were to reduce dangerous greenhouse gases and counteract global warming. The current COP20 in Lima builds on twenty years of mushrooming in a flawed system without tools to secure meaningful negotiations and reject derailments caused by powerful nations such as the United States and China. Meanwhile, depression¹ is spreading from climate scientists to larger parts of the planet’s population.
Carbon dioxide emissions 2013 – China, the United States, India and Russia
2014
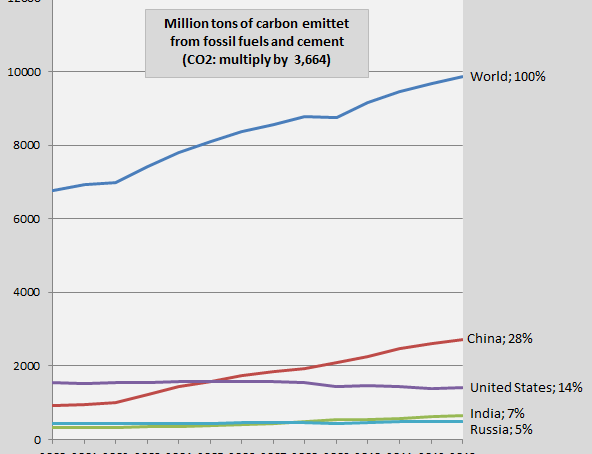
The diagram shows the global development of carbon dioxide emissions from fossil fuels and cement 2000-2013 (measured by pure carbon) and of the four largest emitters China, the United States, India and Russia. The 2013-emissions are preliminary with an enlarged uncertainty of ±5%. The national shares of the global emissions in 2013 are shown in percent to the right. The four countries accounted for 54% of the global emissions in 2013 (48% in 2000). The preliminary carbon dioxide emissions in 2013 of 216 countries is available ‘here’¹. Global emissions are on track of the worst out of four scenarios, likely heading for 3.2-5.4°C increase in temperature by 2100, since pre-industrial era (see the diagram below from ‘Global Carbon Project’, and ‘presentation (pdf)‘.
The missing Global Climate Fund
2014
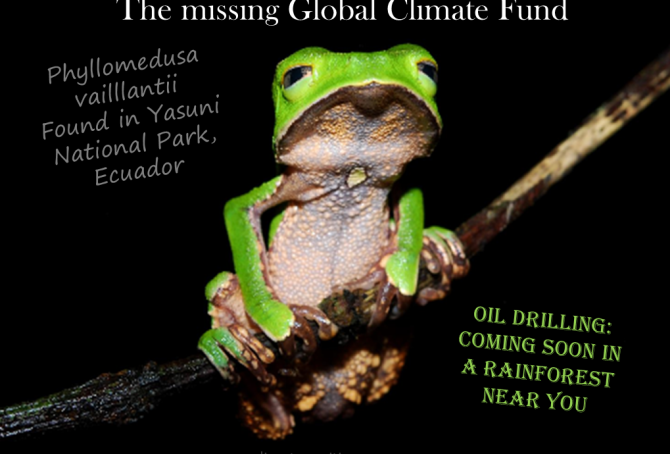
When the necessary climate change financing is secured on a global scale (in our dreams) the paid Climate Contributions must be spent wisely and fair … but how and decided by whom? Well, the incriminated nations that burned fossil fuels excessively for decades knowing that it destroys the climate worldwide can’t be legitimate decision-making participants in the creation of a Global Climate Fund. Only Contribution Free countries can (including those who have paid their climate debt). The opposite seems to be the case in the everlasting and fruitless United Nations COP process.
The United States’ war on terror and climate change
2014
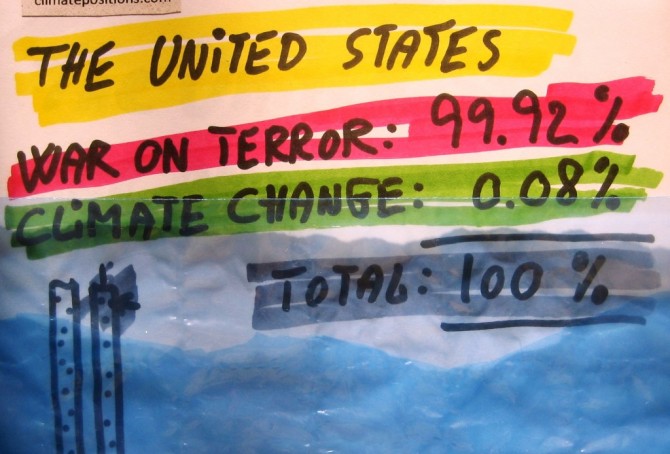
Since dawn the United States has thwarted a binding global climate agreement – if necessary by the use of illegal spying on countries with opposing plans. The U.S. negotiating line is now the main track at the COP Summits and the rest is sadness. Now, U.S. Secretary of State John Kerry says that climate change ranks among the world’s most serious problems, such as disease outbreaks, poverty, terrorism and the proliferation of weapons of mass destruction (more about his speech ‘here’). But how much money has the United States spent on the so called “war on terror”? … And how much addressing the climate change disaster?
Outsourcing of CO2 Emissions from the United States to China
2014
If the United States reduced the CO2 Emissions produced inside its borders and the dirty productions as a competitive consequence moved to China (or elsewhere), the positive impact on the climate would vanish. This obvious dilemma can only be solved if both countries sign a binding climate agreement with solid and fair CO2 Emission targets – which the two countries reject (read more on their COP positions ‘here’). The position of the United States is particularly perverted: 1) Reduction-targets of national CO2 Emissions must be voluntary and 2) Investments in climate actions must be profitable. The bizarre U.S. vision is to create a new global commercial market for voluntary climate investments, a commercial market with parallels to the United States, the homeland of the climate chaos.
COP19 negotiating positions: China, United States, India, Russia and Japan
2014
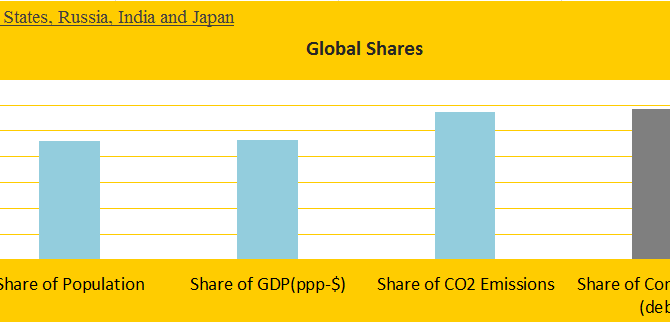
The world’s five largest CO2 emitters – China, United States, Russia, India and Japan – are responsible for 57% of global CO2 Emissions (2006-2010) and 58% of the Climate Contributions (climate debt) in ClimatePositions 2010 (see the front diagram). Add to the group the populous Contribution Free countries Pakistan, Bangladesh, Nigeria, Philippines and Ethiopia and the total share would almost reflect the world average of Population (56%), CO2 Emissions (59%) and Climate Contributions (58%). Leaders of these ten countries sitting around an imaginary negotiating table should be able to create a global climate agreement with binding CO2 reductions and full financing – but it will not happen!
The following depicts the submissions, basic statistics and negotiating positions at COP19 in Warsaw of the five largest CO2 emitters. See the five countries’ Contributions over time ‘here‘, the Contributions as a percentage of GDP ‘here‘ and read about the COP19 country groups ‘here‘.
Country groups and positions at COP19
2013
The negotiation process during COP19 in Warsaw in November 2013 was frustrating and largely fruitless and the following organizations and movements withdrew from the climate conference in protest: ‘Aksyon Klima Pilipinas‘, ‘ActionAid‘, ‘Bolivian Platform on Climate Change‘, ‘Construyendo Puentes‘ (Latin America), ‘Friends of the Earth‘ (Europe), ‘Greenpeace‘, ‘Ibon International‘, ‘International Trade Union Confederation‘, ‘LDC Watch‘, ‘Oxfam International‘, ‘Pan African Climate Justice Alliance‘, ‘Peoples’ Movement on Climate Change‘ (Philippines) and ‘WWF‘.
First step to understanding the inherent conflicts of interest in the COP process would be to examine the nature of the COP country groups (submission groups) – a detailed study of the complex negotiating proces is another matter.
