Fossil CO2 Emissions: European Union, United States and China (Per capita and Total)
/2025/ The graphs below show the Fossil CO2 Emissions in tons Per capita from EU-27 in comparison to the United States, China and global emissions. Chinese emissions Per capita exceeded the global average around 2004 and EU-27 around 2011.

Climate Debt of China 2025: $2698 Billion or 29.1% of the Global Climate Debt (or $1915 Per Capita)
/2025/ China ranks 31st in Climate Debt Per Capita accumulated 2000-2025. Below are some key figures in the calculations. The diagram above shows the Fossil CO2 Emissions Per Capita and the Free Level of emissions (green). The wide straight red line shows emissions in the 1990s (baseline in the calculations).
China: Per Capita Climate Debt $1,240 (Ranked 44) – Fossil CO2 Emissions
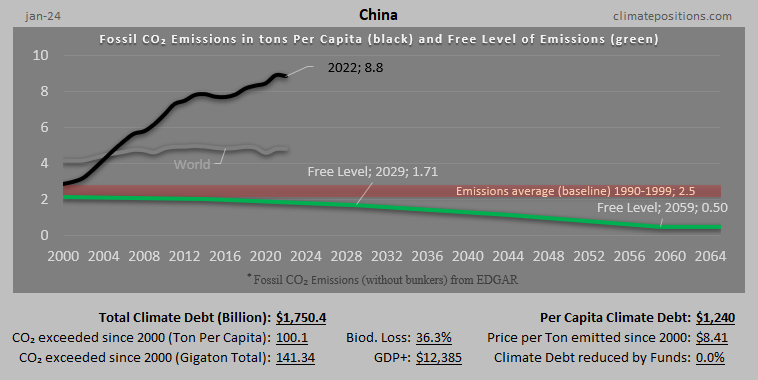
In 2024, China is responsible for 22.37% of the Global Climate Debt accumulated since 2000. Below are some key figures in the calculations.
2024: Ranking updates now available (Global Climate Debt increases by 1.4 trillion dollars in two years)
/2024/ A new version of ClimatePositions Calculation Excel is now available in the menu. Updated rankings by country are also available in the menus.
In January 2024, the Global Climate Debt (accumulated since 2000) was 7.8 Trillion dollars, which is an increase of 700 Billion dollars annually since 2022. This reflects the tragic fact that global CO2 Emissions from Fossil Fuels were 6.7% higher in 2022 than in 2020.

Oman – per capita Fossil CO2 Emissions and Climate Debt
2020
Oman’s current Climate Breakdown Pricing amounts to $44.28 per tons Fossil CO2 emitted since 2000. The Climate Debt grew from $9,261 per capita in 2015 to $13,602 in 2020. Updated Rankings of 165 countries are available in the menu “Climate Debt”.
The following diagrams expose the trends of Fossil CO2 Emissions, Climate Debt, GDP(ppp-$), Population growth and Ecological Footprint without carbon.
Uzbekistan – per capita Fossil CO2 Emissions and Climate Debt
2020
Uzbekistan’s current Climate Breakdown Pricing amounts to $1.20 per tons Fossil CO2 emitted since 2000. The Climate Debt grew from $43 per capita in 2015 to $93 in 2020. Updated Rankings of 165 countries are available in the menu “Climate Debt”.
The following diagrams expose the trends of Fossil CO2 Emissions, Climate Debt, GDP(ppp-$) and Environmental Performance.

Pakistan – per capita Fossil CO2 Emissions (zero Climate Debt)
2020
Although Pakistan’s accumulated Climate Debt is zero, the populous country is the world’s 32nd largest emitter of Fossil CO2.
The following diagrams expose the trends of Fossil CO2 Emissions, GDP(ppp-$), Environmental Performance and Ecological Footprint without carbon.

Malaysia – per capita Fossil CO2 Emissions and Climate Debt
2020
Malaysia’s current Climate Breakdown Pricing amounts to $20.82 per tons Fossil CO2 emitted since 2000. The Climate Debt grew from $1,454 per capita in 2015 to $2,902 in 2020. Updated Rankings of 165 countries are available in the menu “Climate Debt”.
The following diagrams expose the trends of Fossil CO2 Emissions, Climate Debt, GDP(ppp-$) and Ecological Footprint without carbon.
Vietnam – per capita Fossil CO2 Emissions and Climate Debt
2020
Vietnam’s current Climate Breakdown Pricing amounts to $0.88 per tons Fossil CO2 emitted since 2000. The Climate Debt grew from $6 per capita in 2015 to $26 in 2020. Updated Rankings of 165 countries are available in the menu “Climate Debt”.
The following diagrams expose the trends of Fossil CO2 Emissions, Climate Debt, GDP(ppp-$), Forest Cover, Primary Forest and Ecological Footprint without carbon.

Thailand – per capita Fossil CO2 Emissions and Climate Debt
2020
Thailand’s current Climate Breakdown Pricing amounts to $7.92 per tons Fossil CO2 emitted since 2000. The Climate Debt grew from $265 per capita in 2015 to $535 in 2020. Updated Rankings of 165 countries are available in the menu “Climate Debt”.
The following diagrams expose the trends of Fossil CO2 Emissions, Climate Debt, GDP(ppp-$) and Ecological Footprint without carbon.

Taiwan – per capita Fossil CO2 Emissions and Climate Debt (estimated)
2020
Due to lack of some indicator data from the ‘sources‘ Taiwan is not ranked in ClimatePositions. However, by estimating the indicator values of GDP(ppp-$)¹, Forest Cover² and Ecological Footprint³, then the calculation of Taiwan’s Climate Debt can still be made with some accuracy.
With the noted indicator assumptions, then the Taiwanese current Climate Breakdown Pricing amounts to $40 per tons Fossil CO2 emitted since 2000, and the per capita Climate Debt amounts to $8,800 in 2020. For comparison, updated Rankings of 165 countries with full data are available in the menu “Climate Debt” (Taiwan ranks 13th).
The following diagrams expose the trends of Fossil CO2 Emissions, Nuclear Power and Environmental Performance.
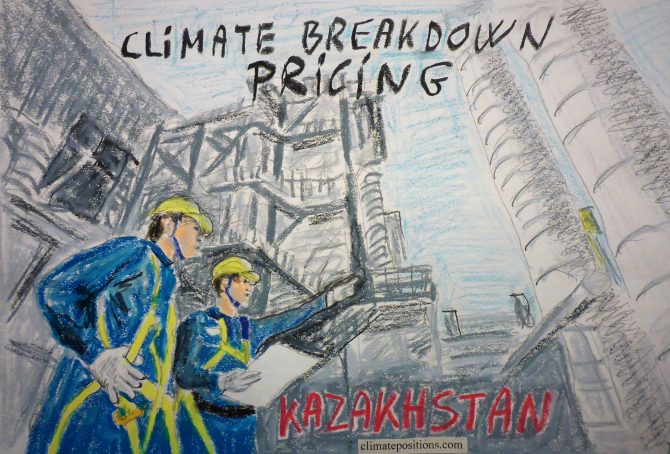
Kazakhstan – per capita Fossil CO2 Emissions and Climate Debt
2020
Kazakhstan’s current Climate Breakdown Pricing amounts to $16.18 per tons Fossil CO2 emitted since 2000. The Climate Debt grew from $2,041 per capita in 2015 to $4,025 in 2020. Updated Rankings of 165 countries are available in the menu “Climate Debt”.
The following diagrams expose the trends of Fossil CO2 Emissions, Climate Debt, GDP(ppp-$) and Ecological Footprint without carbon.

Indonesia – per capita Fossil CO2 Emissions and Climate Debt
2020
Indonesia’s current Climate Breakdown Pricing amounts to $4.50 per tons Fossil CO2 emitted since 2000. The Climate Debt grew from $82 per capita in 2015 to $147 in 2020. Updated Rankings of 165 countries are available in the menu “Climate Debt”.
The following diagrams expose the trends of Fossil CO2 Emissions, Climate Debt, GDP(ppp-$), Ecological Footprint without carbon, Forest Cover and Primary Forest.

Saudi Arabia – per capita Fossil CO2 Emissions and Climate Debt
2020
Saudi Arabia’s current Climate Breakdown Pricing amounts to $45.11 per tons Fossil CO2 emitted since 2000. The Climate Debt grew from $5,683 per capita in 2015 to $13,955 in 2020. Updated Rankings of 165 countries are available in the menu “Climate Debt”.
The following diagrams expose the trends of Fossil CO2 Emissions, Climate Debt, GDP(ppp-$) and Ecological Footprint without carbon.

Iran – per capita Fossil CO2 Emissions and Climate Debt
2020
Iran’s current Climate Breakdown Pricing amounts to $15.69 per tons Fossil CO2 emitted since 2000. The Climate Debt grew from $1,095 per capita in 2015 to $2,153 in 2020. Updated Rankings of 165 countries are available in the menu “Climate Debt”.
The following diagrams expose the trends of Fossil CO2 Emissions, Climate Debt, GDP(ppp-$), Ecological Footprint (without carbon) and Nuclear Power.
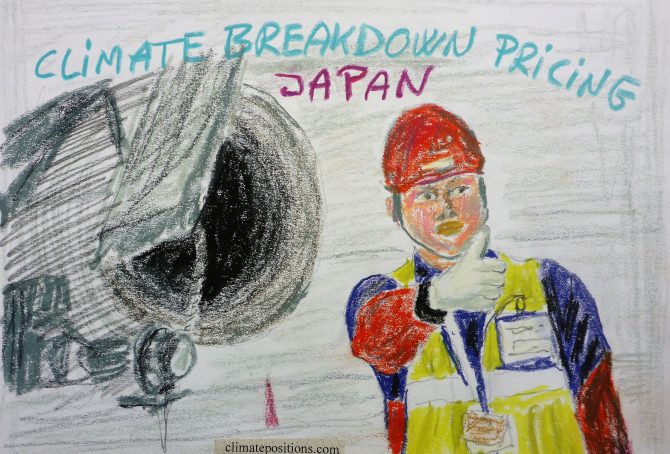
Japan – per capita Fossil CO2 Emissions and Climate Debt
2020
Japan’s current Climate Breakdown Pricing amounts to $20.35 per tons Fossil CO2 emitted since 2000. The Climate Debt grew from $1,952 per capita in 2015 to $3,734 in 2020. Updated Rankings of 165 countries are available in the menu “Climate Debt”.
The following diagrams expose the trends of Fossil CO2 Emissions, Climate Debt, GDP(ppp-$), Nuclear Power and Ecological Footprint without carbon.

Russia – per capita Fossil CO2 Emissions and Climate Debt
2020
Russia’s current Climate Breakdown Pricing amounts to $12.16 per tons Fossil CO2 emitted since 2000. The Climate Debt grew from $1,346 per capita in 2015 to $2,676 in 2020. Updated Rankings of 165 countries are available in the menu “Climate Debt”.
The following diagrams expose the trends of Fossil CO2 Emissions, Climate Debt, GDP(ppp-$) and Ecological Footprint without carbon.
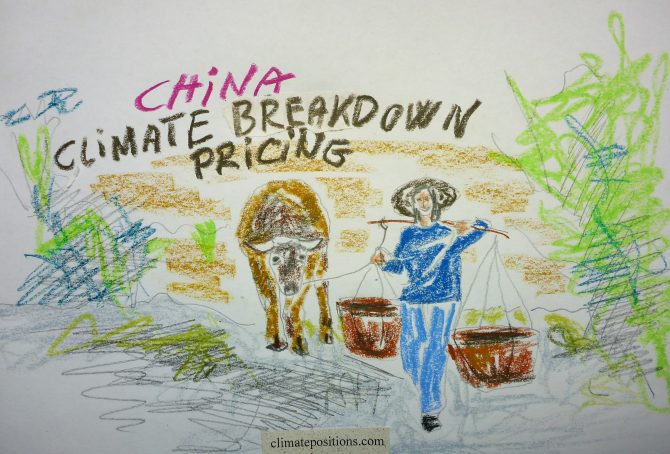
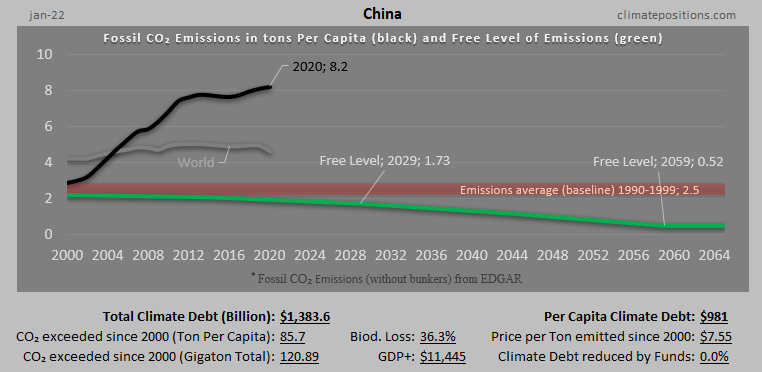
China – per capita Fossil CO2 Emissions and Climate Debt
2020
China’s current Climate Breakdown Pricing amounts to $12.33 per tons Fossil CO2 emitted since 2000. The Climate Debt grew from $593 per capita in 2015 to $1,395 in 2020. Updated Rankings of 165 countries are available in the menu “Climate Debt”.
The following diagrams expose the trends of Fossil CO2 Emissions, Climate Debt, GDP(ppp-$) and Ecological Footprint without carbon.
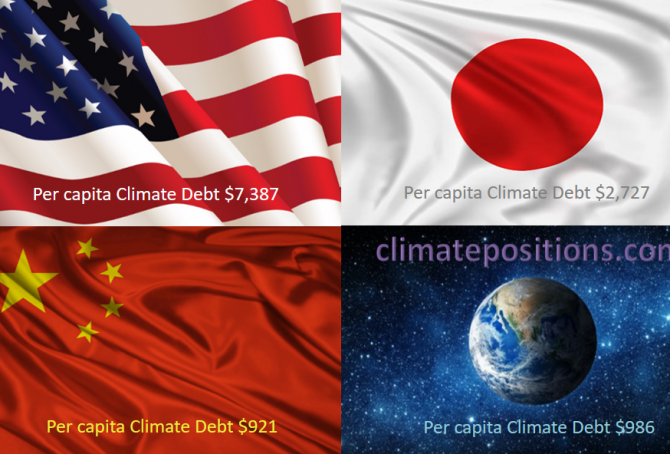
Share of global Climate Debt rank 1st, 2nd and 3rd: The United States, China and Japan (combined responsible for 55% of Climate Debt and 47% of Fossil CO2 Emissions 2016)
2017
The diagram below shows ‘Share of global Climate Debt‘ in 2010, 2015 and 2017 of the United States, Japan and China (ranked 1st, 2nd and 3rd). The shares of the United States and Japan are decreasing at slower rates lately, whereas China’s is increasing fast. Global Climate Debt accumulated since 2000 is $7.2 Trillion.