South Africa – the world’s 13th largest CO2 emitter (coal, coal and more coal … and inequality)
South Africa populates 0.7% of the planet’s people and emits 1.3% of the world’s CO2 from fossil fuels (without bunkers) and cement production. The Climate Debt of the 54 million South African’s amounts to $39 billion, or $720 per capita, and the ‘Ranking’ was 42nd among 148 countries by January 2016 – in 2010 the ranking was 45th.
The first diagram shows South Africa’s per capita CO2 Emissions from fossil fuels (without bunker fuels) and cement production in decades in comparison with the world average. CO2 Emissions 2012-2014 are preliminary estimates. The green bars are the Contribution Free Level, determined by the level of CO2 Emissions in the 1990s and a number of continuously updated ‘Indicators’.
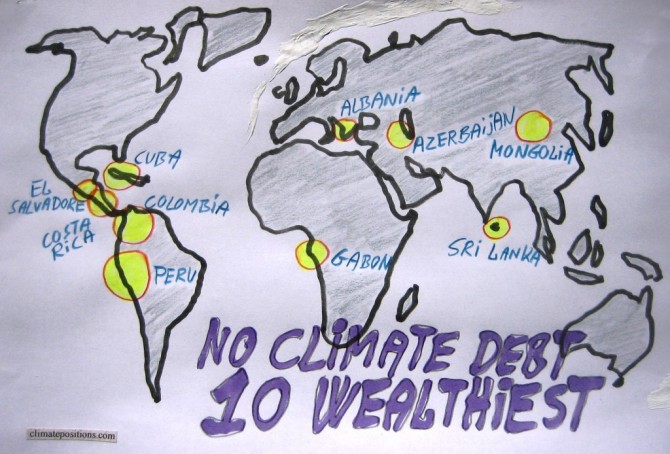
The ten wealthiest countries without any Climate Debt
2015
Among the 147 countries with full data in ClimatePositions 65 are Contribution Free (no Climate Debt). See the ‘ranking’. The table in this article ranks (from 1 to 10) the ten wealthiest Contribution Free countries by the following eight indicators:
- Per capita GDP(ppp-$) (1 = wealthiest)
- Income Equality (1 = most equal)
- Per capita CO2 Emissions from fossil fuels (1 = lowest emissions)
- Democracy Index (1 = most democracy)
- Environmental Performance (1 = best performance)
- Life Expectancy by birth (1 = longest lives)
- Per capita Ecological Footprint without carbon (1 = smallest footprint)
- Primary Forests as a percentage of the total land area (1 = largest percentage)
Read the comments below the table.

65 Contribution Free countries…GDP-ranked (with Income Equality, Life Expectancy and Environmental Performance)
2014
65 out of 147 countries with full data in ClimatePositions are Contribution Free (no climate debt). 41% of the world’s population lives in these Contribution Free countries and they emitted only 9% of the global carbon dioxide from fossil fuels in 2012 – without India the corresponding figures are 24% of the global population and 3% of the emissions.
The table below shows the 65 Contribution Free countries ranked by GDP(ppp-$) per capita, with Income Equality (‘Atkinson Index‘), Life Expectancy and Environmental Performance. The world’s average GDP(ppp-$) per capita was $13.791 in 2012. Analysis and comments see below the table – the color codes are explained in the bottom.
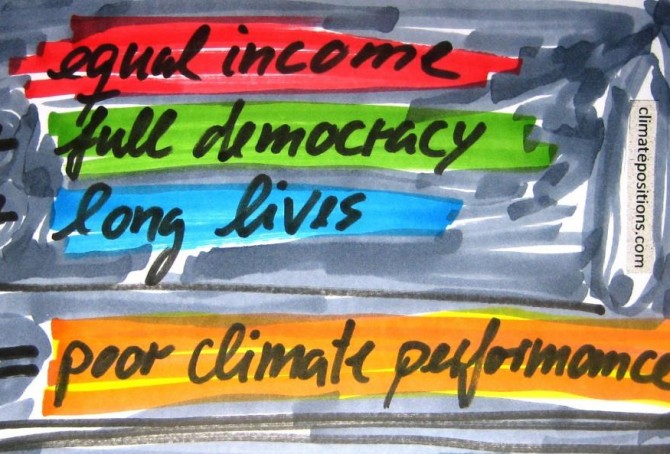
Income Equality, Life Expectancy, Democracy Index … and Climate Contributions
2014
123 out of 145 countries with full data in ClimatePositions are included in an inventory of Income Equality (see the source at the bottom), which shows how much the 10% poorest earns compared to the 10% richest. 53 out of the 123 countries are Contribution Free (no climate debt) in ClimatePositions 2010 and 70 countries are not.
The table below shows the difference between the two groups of countries in terms of Income Equality, Life Expectancy, number of Full Democracies and number of Authoritarian Regimes. To clarify the trend the 20 countries with the largest Climate Contributions appear at the top of the table. The 123 countries represent 95% of the world population.