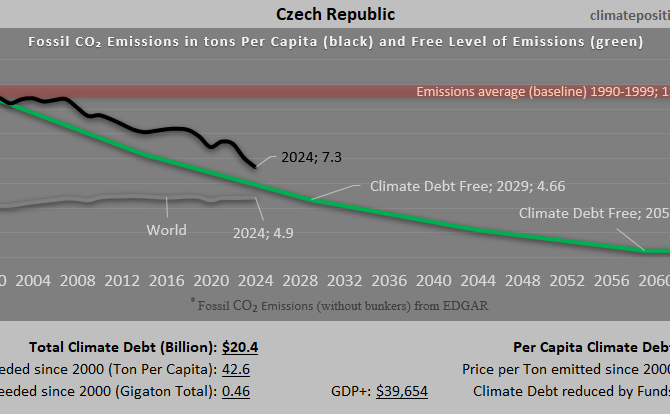
Climate Debt of Czech Republic 2025: $20 Billion or 0.22% of the Global Climate Debt (or $1874 Per Capita)
/2025/ Czech Republic ranks 32nd in Climate Debt Per Capita accumulated 2000-2025. Below are some key figures in the calculations. The diagram above shows the Fossil CO2 Emissions Per Capita and the Free Level of emissions (green). The wide straight red line shows emissions in the 1990s (baseline in the calculations).
Czech Republic: Per Capita Climate Debt $2,685 (Ranked 22) – Fossil CO2 Emissions
In 2024, Czech Republic is responsible for 0.36% of the Global Climate Debt accumulated since 2000. Below are some key figures in the calculations.

Austria – per capita Fossil CO2 Emissions and Climate Debt
2020
Austria’s current Climate Breakdown Pricing amounts to $26.30 per tons Fossil CO2 emitted since 2000. The Climate Debt grew from $2,401 per capita in 2015 to $4,371 in 2020. Updated Rankings of 165 countries are available in the menu “Climate Debt”.
The following diagrams expose the trends of Fossil CO2 Emissions, Climate Debt, GDP(ppp-$) and Ecological Footprint without carbon.

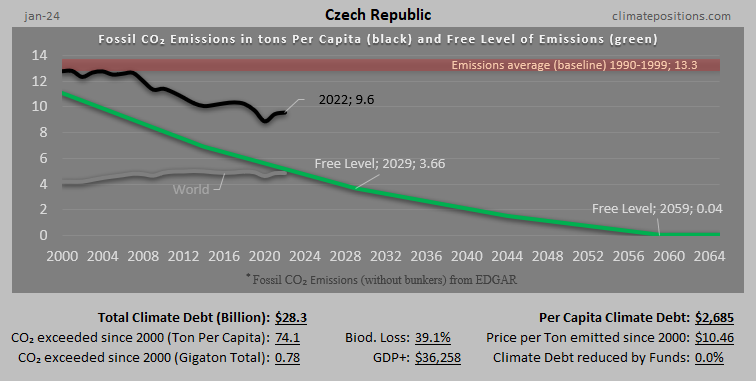
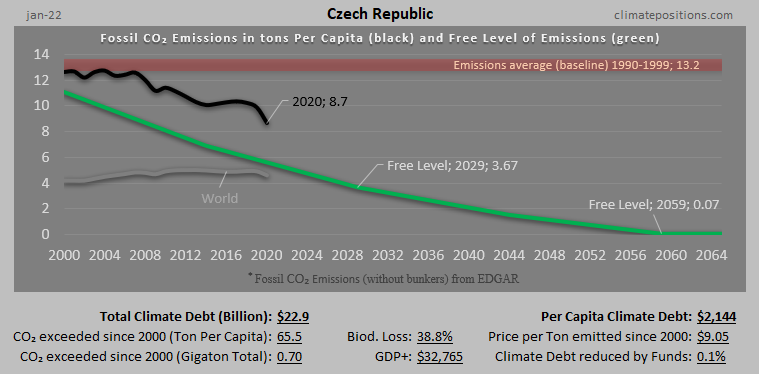
Czech Republic – per capita Fossil CO2 Emissions and Climate Debt
2020
The current Climate Breakdown Pricing of Czech Republic amounts to $15.33 per tons Fossil CO2 emitted since 2000. The Climate Debt grew from $1,398 per capita in 2015 to $3,356 in 2020. Updated Rankings of 165 countries are available in the menu “Climate Debt”.
The following diagrams expose the trends of Fossil CO2 Emissions, Climate Debt, GDP(ppp-$) and Nuclear Power.
Poland – per capita Fossil CO2 Emissions and Climate Debt
2020
Poland’s current Climate Breakdown Pricing amounts to $9.87 per tons Fossil CO2 emitted since 2000. The Climate Debt grew from $593 per capita in 2015 to $1,555 in 2020. Updated Rankings of 165 countries are available in the menu “Climate Debt”.
The following diagrams expose the trends of Fossil CO2 Emissions, Climate Debt, GDP(ppp-$) and Ecological Footprint without carbon.
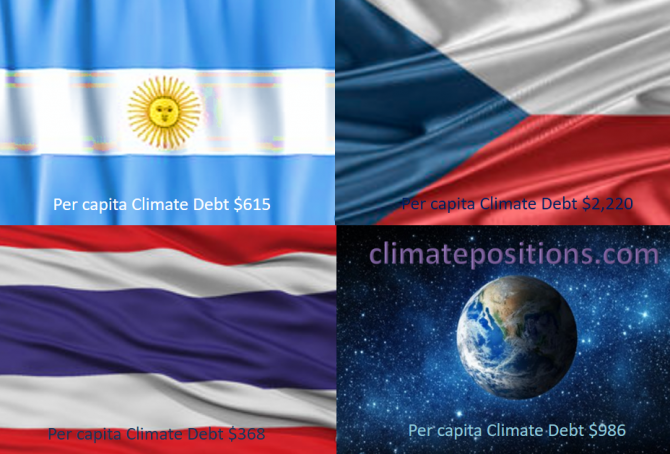
Share of global Climate Debt rank 31st, 32nd and 33rd: Argentina, Thailand and Czech Republic (combined responsible for 1.0% of Climate Debt and 1.6% of Fossil CO2 Emissions 2016)
2017
The diagram below shows ‘Share of global Climate Debt‘ in 2010, 2015 and 2017 of Argentina, Thailand and Czech Republic (ranked 31st, 32nd and 33rd). The share of Argentina is increasing while the share of Thailand has flattened out.
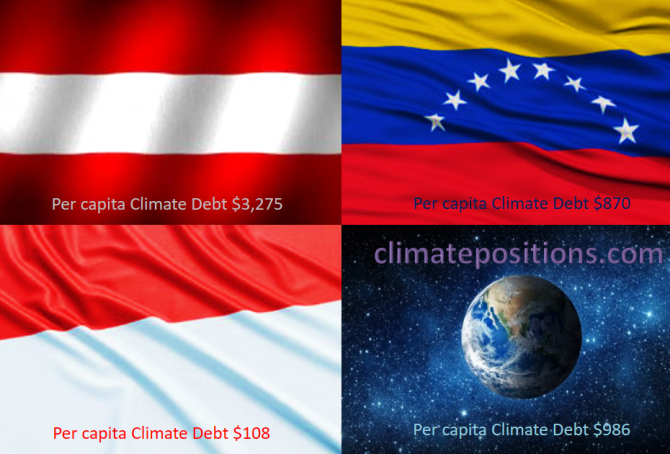
Share of global Climate Debt rank 28th, 29th and 30th: Austria, Indonesia and Venezuela (combined responsible for 1.2% of Climate Debt and 2.2% of Fossil CO2 Emissions 2016)
2017
The diagram below shows ‘Share of global Climate Debt‘ in 2010, 2015 and 2017 of Austria, Indonesia and Venezuela (ranked 28th, 29th and 30th). In 2015, the shares of each of the three countries were 0.40 or 0.41% of global Climate Debt.

Climate Debt: Australia ranks 8th (performance of the twenty largest coal producers)
2016
Australia covers around 5.7% of planet’s land area and populates 0.3% of its people. The Climate Debt of the 24 million Australian’s amounts to $132 billion, or $5,613 per capita, which ‘Ranks’ Australia 8th among 148 countries – in 2010 the ranking was 6th. Australia is the world’s 5th largest coal producer and the 2nd largest per capita CO2 emitter from coal combustion … and coal is the most efficient climate destroyer. The table below reveals some key figures of the world’s twenty largest coal producers. Subsequently, Australia’s climate change performance is examined in comparison with four other top-five countries on CO2 Emissions from coal combustion (per capita): Kazakhstan (ranked 1), South Africa (3), the United States (4) and Poland (5).

Climate change performance of Austria, Czech Republic and Switzerland
2015
0.4% of the global population lives in Austria, Czech Republic or Switzerland and together they emitted 0.6% of the global CO2 from fossil fuels in 2012 – the joint share of the global Climate Debt is 0.7%. Austria’s updated Climate Debt per capita is $2,400 (ranked 19th), Czech Republic’s is $1,137 (ranked 34th) and Switzerland’s is $969 (ranked 38th). See the ‘ranking’. The following examines the Climate Debt trends and the indicators of CO2 Emissions (carbon dioxide from fossil fuels), Nuclear Power, Environmental Performance, GDP(ppp-$) and Climate Debt as a percentage of GDP(ppp-$).
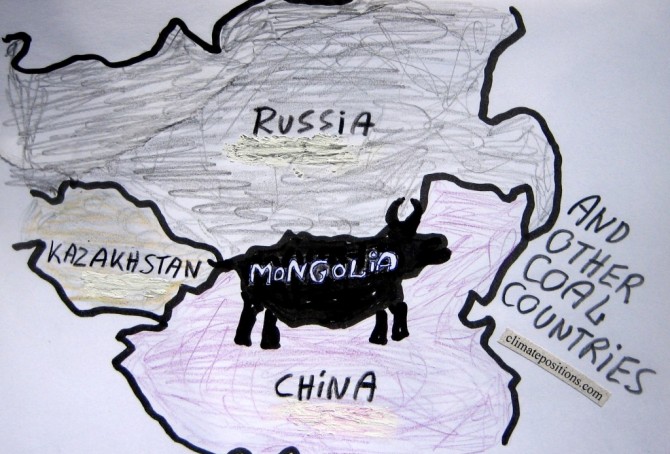
Mongolia and other coal producing countries (the thirteen most coal-dependent countries)
2015
Mongolia is the world’s second largest coal producer per capita (Btu, 2011) and coal is the world’s no. 1 carbon dioxide emitter. However, the flawed democracy (surrounded by the giant authoritarian regimes of China and Russia) is Contribution Free (no Climate Debt) in ClimatePositions – how is this possible?
The table below ranks the thirteen largest per capita coal producers (Btu, 2011), with the world average set at 1.0. The Mongolian coal production is almost ten times larger than the world average. For comparison, the table shows per capita values of CO2 Emissions (from fossil fuels), GDP(ppp-$) and Climate Debt. More comments below the table.
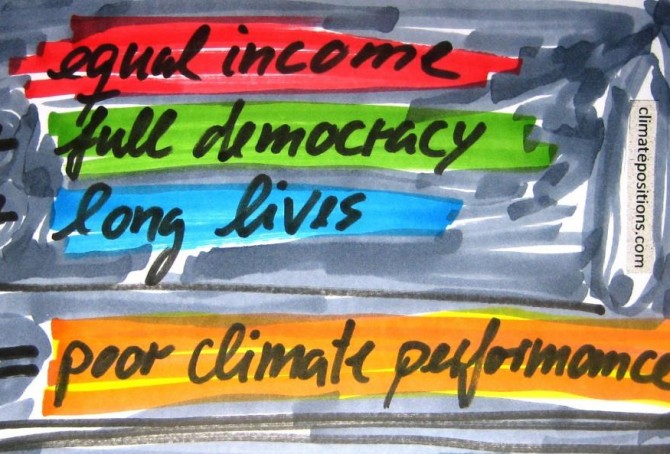
Income Equality, Life Expectancy, Democracy Index … and Climate Contributions
2014
123 out of 145 countries with full data in ClimatePositions are included in an inventory of Income Equality (see the source at the bottom), which shows how much the 10% poorest earns compared to the 10% richest. 53 out of the 123 countries are Contribution Free (no climate debt) in ClimatePositions 2010 and 70 countries are not.
The table below shows the difference between the two groups of countries in terms of Income Equality, Life Expectancy, number of Full Democracies and number of Authoritarian Regimes. To clarify the trend the 20 countries with the largest Climate Contributions appear at the top of the table. The 123 countries represent 95% of the world population.