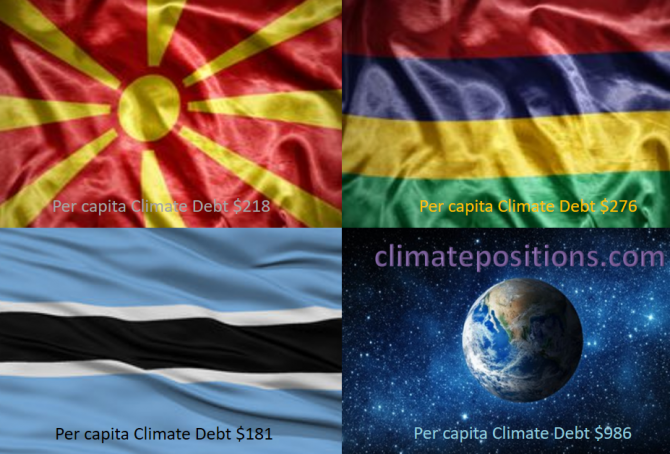
Share of global Climate Debt rank 79th, 80th, and 81st: Macedonia, Botswana and Mauritius (combined responsible for 0.02% of Climate Debt and 0.05% of Fossil CO2 Emissions 2016)
2018
The diagram below shows ‘Share of global Climate Debt‘ in 2010, 2015 and 2017 of Macedonia, Botswana and Mauritius (ranked 79th, 80th, and 81st). The global Climate Debt, accumulated since 2000, is $7.2 Trillion.
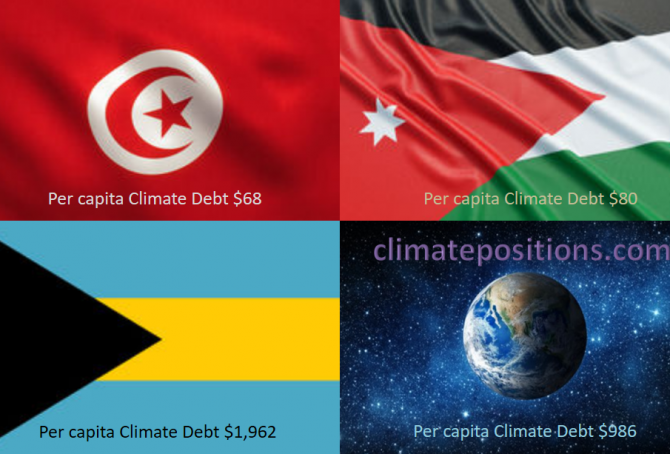
Share of global Climate Debt rank 76th, 77th and 78th: Tunisia, Bahamas and Jordan (combined responsible for 0.03% of Climate Debt and 0.16% of Fossil CO2 Emissions 2016)
2018
The diagram below shows ‘Share of global Climate Debt‘ in 2010, 2015 and 2017 of Tunisia, Bahamas and Jordan (ranked 76th, 77th and 78th). The share of Tunisia is continuously declining, whereas the shares of Bahamas and Jordan are uneven.

Global Carbon Project (CDIAC), located in the United States, stops publishing carbon emissions data by country – will be replaced by EDGAR in ClimatePositions
2017
The Carbon Dioxide Information Analysis Center (CDIAC), located at the U.S. Department of Energy’s (DOE) Oak Ridge National Laboratory, has published annual Carbon Emissions from Fossil Fuels and cement production by country since 1959 (‘Global Carbon Project‘), but now this continuous time series has come to an end and 2015 will be the last data-year (as it seems).
Since carbon emissions data from CDIAC (Global Carbon Project) is the core ‘Indicator‘ in ClimatePositions’ calculation of Climate Debt, carbon emissions data will be replaced with nearly similar data from ‘EDGAR‘ (‘European Commission‘ / ‘Climate Action‘), retroactively since 1990, in connection with the coming updates [done 16-08-2017].
The following describes the differences between CO2 Emissions data from Global Carbon Project (CDIAC) and EDGAR (sourced: European Commission, Joint Research Centre (JRC)/Netherlands Environmental Assessment Agency (PBL). Emission Database for Global Atmospheric Research (EDGAR)), and the consequences in terms of Climate Debt in ClimatePositions – illustrated with a range of country examples. Note that other sources, such as ‘IEA‘, ‘EIA‘ and ‘BP‘, provides CO2 Emissions data-sets different from the ones of CDIAC and EDGAR.
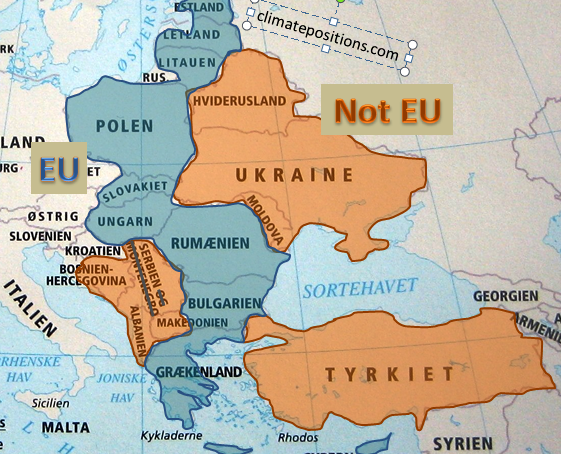
European Union “east” compared to bordering countries
2015
The ‘European Union’ (EU) is an economic and political partnership between ‘28 countries’. Around 7% of the global population lives in EU and they emit around 12% of the global CO2 from fossil fuels and are responsible of 13% of the Climate Debt in ClimatePositions. The following examines a group of 10 countries in eastern EU which joined the union between 1981 and 2007 in comparison with 8 bordering countries.

Impressive performance by Costa Rica
2013
In 2010 ‘Costa Rica‘ was the only Contribution Free, full democratic country with a GDP(ppp-$) above the global average. The diagram above shows the national CO2 Emissions per capita (the black bars) and the Contribution Free Levels of CO2 Emissions (the green bars) in 2000-2011. Note that Costa Rica could have increased CO2 Emissions (carbon dioxide) from 1.2 ton CO2 per capita in 2000 to 1.9 tons in 2011 and still be Contribution free, due to other fine indicator values.