Global indicator updates: Land-Ocean Air Temperature, Sea Level, CO2 in the Atmosphere and Population
2019
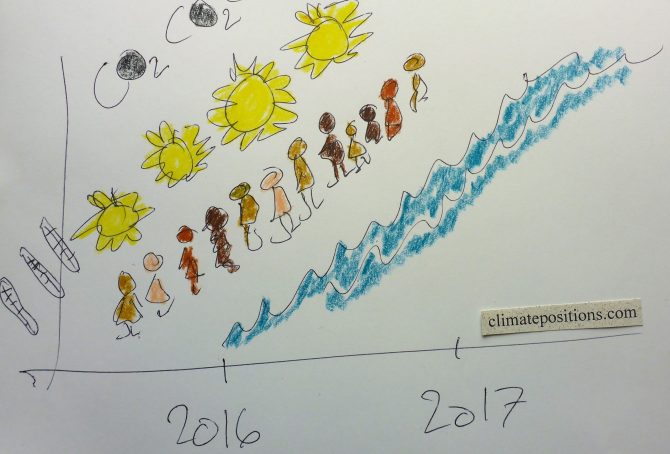
The four global Indicators: 1) Land-Ocean Air Temperature, 2) Sea Level, 3) CO2 in the Atmosphere and 4) Population, have all been updated in ClimatePositions. Combined, the updates resulted in significant increases in national Climate Debts (the first two, due to adjustments of the national GDP-Factor and the last two, due to adjustments of the global Fossil CO2 Emission target). As an example, India’s Climate Debt increased from $0.30 per capita (rounds to zero), to $2 per capita, only because of the global Indicator updates.
Diagrams with the four global Indicators are shown below.
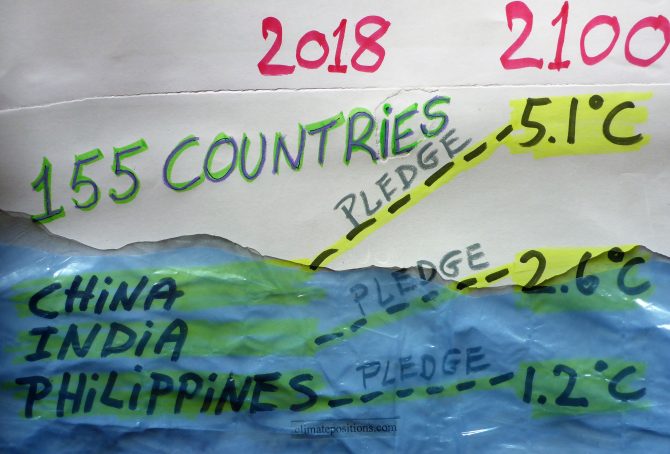
Study: National climate pledges and the resulting Global Warming by 2100 (The Pledged Warming Map)
2018
The Paris Agreement collectively committed the countries to limit Global Warming to well below 2°C and pursue efforts to limit warming to 1.5°C above preindustrial levels. However, how much Global Warming by 2100 is each country’s climate pledge leading to, if all countries adopted the same national approach and ambition? This question is being tried answered for the world’s countries on the new website ‘paris-equity-check.org‘ (Pledged Warming Map). The underlying ‘Peer-reviewed study‘ is published November 2018 in Nature Communications.
The site says: “The Paris Agreement includes bottom-up pledges and a top-down warming threshold. Under this setting where countries effectively choose their own fairness principle, Paris-Equity-Check.org presents scientifically peer-reviewed assessments the ambition of countries’ climate pledges (the Nationally Determined Contributions or NDCs) and address the question: What is a fair and ambitious contribution to achieving the Paris Agreement?” Read ‘Ambition of pledges‘ and ‘The science‘.
The table below shows 155 countries’ 1) ‘Per capita Climate Debt‘ in 2017, accumulated since 2000 in ClimatePositions, 2) per capita Fossil CO2 Emissions 2016, and 3) the pledges estimated effect on Global Warming by 2100 (Pledged Warming Map).
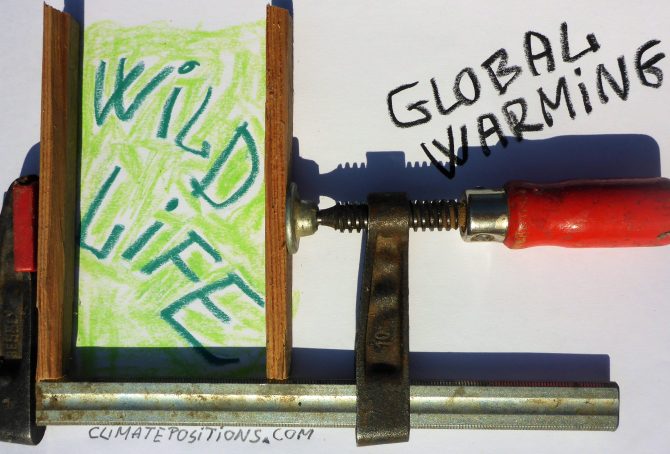
Global Warming: Goodbye World Wildlife Heritage
2018
World Wildlife Heritage is miraculous. However, human caused Climate Change is a brutal attack on the biodiverse wildlife on Earth. In a recent analysis ‘Published in the journal Science‘ data were gathered on geographic ranges and current climate conditions of 31,000 insect species, 8,000 birds, 1,700 mammals, 1,800 reptiles, 1,000 amphibians and 71,000 plants. Then, it was calculated how the ranges change when global warming means some regions can no longer support particular species. The analysis only took global warming as such into consideration, not the impact of lost interactions between species or the impacts of more extreme weather events; nor the interaction with wildlife degradation for other reasons.
Global indicator updates: Land-Ocean Temperature, Sea Level, CO2 in the Atmosphere and Population
2018
The four global Indicators: Land-Ocean Temperature, Sea Level, CO2 in the Atmosphere and Population have been updated in ‘ClimatePositions (Excel)‘. Combined, the updates resulted in significant increases in national Climate Debts. Land-Ocean Temperature and Sea level due to adjusting the national GDP-Factor, while CO2 in the Atmosphere and Population due to adjusting the global Fossil CO2 Emission Target.
Diagrams with the four global Indicators are shown below [diagram were replaced 15-02-2018].

Global warming: pre-industrial temperature, baselines, measurements and the 2C limit
2017
194 countries have agreed to hold the increase in the global average temperature to well below 2°C above pre-industrial levels. However, neither “global average temperature” nor “pre-industrial levels” are defined in the agreement. Furthermore, different scientific groups produce different temperature datasets, which are not exactly the same because of differences in the methodologies (and to complete the absurdity, the Paris Agreement contains no binding national emission pathways to the overall goal). The following temperature survey refers to datasets from ‘National Oceanic and Atmospheric Administration (NOAA)‘.
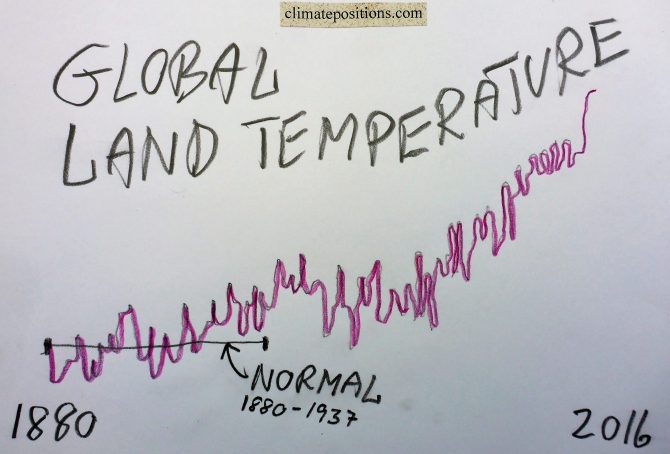
The diagram below shows the global surface (air) temperature 1880-2016 over 1) Land, 2) Ocean and 3) Land/Ocean combined (which is most commonly used). All three baselines are 1880-1937 (set at 0°C) and the dashed lines show the average trends. Apparently, global (air) warming happens considerably faster on land than on oceans. By the way, the global warming in 2016, baseline 1880-1937, was 1.73°C (Land), 0.94°C (Ocean) and 1.15°C (Land/Ocean).
Added 07-02-2017: Soon, the global temperature ‘Indicator’ in ClimatePosition will be changed from Land (air) Temperature (10-years average) to Land/Ocean (air) Temperature (10-years average). The change will not affect the current accumulated Climate Debt of any country, only the future calculation.
Global Indicator Update: Land Temperature 2016 (warmest year on record)
2017
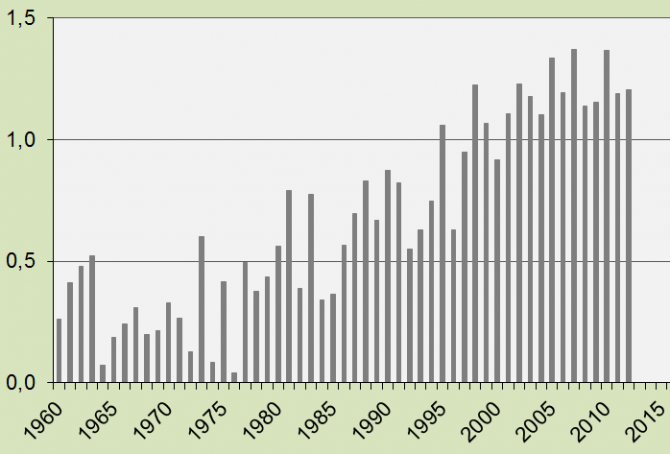
The year 2016 was by far the hottest on planet Earth since measurements began in 1880. Both global Land (air) Temperature and Ocean (air) Temperature were the hottest on record. See the development in Land Temperature between 1960 and 2016 in the diagram below. The average temperature rise 1880-1937 is set at 0°C (baseline 1880-1937) and 2016 was 1.73°C warmer. The development since 1880 in Land Temperature and Ocean Temperature (and the two combined) are available at ‘ncdc.noaa.gov‘.
Added 22-01-17: The Ocean Temperature 2016 was 0.94°C warmer compared to baseline 1880-1937, and Land and Ocean Temperature combined was 1.15°C warmer. Note that other sources may refer to baseline 1881-1910 or even 1951-1980.
Added 07-02-2017: Soon, the global temperature ‘Indicator’ in ClimatePosition will be changed from Land (air) Temperature (10-years average) to Land/Ocean (air) Temperature (10-years average). The change will not affect the current accumulated Climate Debt of any country, only the future calculation.

The Kigali Agreement: 30-years phase-out plan for Hydrofluorocarbons (HFCs)
2016
Hydrofluorocarbons (HFCs) is a family of factory-made potent greenhouse gases, used as refrigerants in air conditioning systems in vehicles and buildings, and in aerosol propellants, solvents, fire retardants etc. HFCs were developed as replacements for Chlorofluorocarbons (CFCs) and Hydrochlorofluorocarbons (HCFCs), because these gases deplete the ozone layer. The Kigali Agreement announced mid-October, among more than 170 countries, is an extremely complicated amendment to the ozone-shielding Montreal Protocol from 1987.
HFCs, CFCs and HCFCs are all so called Fluorinated gases, or F-gases, and they are released into the atmosphere through leaks, servicing, disposal of equipment etc. The diagram below from ‘NOAA’ shows the atmospheric content since 1978 of four commonly used F-gases.

Study: Already developed fossil fuel reserves will potentially take us beyond the 2 degree warming limit
2016
A ‘Study (pdf, 60 pages)’ called “The Sky’s Limit” just released by ‘Oil Change International’ finds that already developed reserves¹ of coal, oil and gas, if extracted and burned, will take us beyond the Paris Agreement’s 2°C warming limit (and of cause far beyond the 1.5°C limit). Developed reserves is defined as currently operating fields and mines (projected to run to the end of their probable lifetimes), wells already drilled, pits that are dug, and pipelines, processing facilities, railways and export terminals already constructed. The developed reserves hold roughly 30% of the fossil fuel reserves.
The study finds that the potential CO2 Emissions from these already developed reserves – if extracted and burned – will exceed the 2°C carbon budget calculated by the Intergovernmental Panel on Climate Change (IPCC). The diagram below is copied from the study.

Global ocean temperature January-April 2016 is scary news too (see the graph 1880-2016)
More than 90% of the additional heat trapped in the atmosphere due to human caused greenhouse gases such as carbon dioxide from burning of Fossil Fuels, is absorbed by the oceans. In continuation of the previous ‘Article’ the global ocean (air) temperature January-April 2016 was around 1.0ºC higher than the average temperature January-April between 1880 and 1937 (calculated by ClimatePositions) – see the graph. The black line shows the 136-year-trend. Compose your own graph at ‘http://www.ncdc.noaa.gov/cag/time-series/global’.

Global land temperature January-April is creepy feverish (see the graph 1880-2016)
The world’s two largest economies and carbon dioxide emitters, the United States and China, have thwarted the negotiations toward a globally binding climate agreement for decades. Instead, the world is left with “intended nationally defined contributions” and the “aggregate emission pathways consistent with holding the increase in the global average temperature to well below 2°C above preindustrial levels and pursuing efforts to limit the temperature increase to 1.5°C.” This is of cause warm air, so to speak.

Update 2015: Warmest year on record … mother Earth with fever
The year 2015 was the warmest on Earth since measurements began in 1880. Both global Air Temperature and Ocean Temperature was the warmest on record. See the development in Air Temperature between 1960 and 2015 in the diagram below; the average temperature rise 1880-1937 is set at 0°C and 2015 was 1.64°C warmer.
Sea level rises 58 m if all fossil fuels are extracted and burned
2015
A new ’simulation-study from Postdam Institute for Climate Impact Research’ shows that the Antarctic ice sheet would melt, causing the world’s sea level to rise about 58 m, if all the world’s resources of coal, oil and gas are extracted and burned. The following highlight some of the assumptions and outcomes of the study and besides visualize 30 m and 60 m sea level rise in fourteen of the world’s twenty largest cities (Tokyo, New York City, Seoul, Mumbai, Karachi, Osaka, Shanghai, Beijing, Calcutta, Cairo, London, Dhaka, Paris and Rio de Janeiro).

Polynomial projections of global warming 1880-2014 … 2130
2015
The global Land (air) Temperature of 2014 was the 4th warmest ever measured. Both the global Ocean (air) Temperature and the combined Ocean and Land Temperature of 2014 were the warmest ever measured (see ‘here‘).
A ‘polynomial projection’ (or polynomial interpolation) of temperature is neither a prediction nor a scientific scenario with certain assumptions. A polynomial projection reproduces data into the future in a sounder manner than a linear projection. The five diagrams below show the global Land (air) Temperature since 1880 with polynomial projections from 1980, 1990, 2000, 2010 and 2014 … projected by 2130. The red projection line start at 0°C in 1880 and the passing-years of 1°C, 2°C, 3°C etc. are marked. Read the comments below the diagrams.

IPCC worst case scenarios from 1990 and 2014 (in comparison with the actual global warming)
2014
In October 2014 IPCC’s Fifth Assessment Synthesis Report 2014 was released (IPCC = Intergovernmental Panel on Climate Change). The Summary for Policymakers (40 pages), the Headline Statements (2 pages), the Presentation (PowerPoint, 26 dias) and a Longer Report (116 pages) are available ‘here’. The four sub-reports 2013-2014 (a total of 5622 pages) are available ‘here’. The presentation of the gloomy message is overwhelming and totally confusing to common people (is that really necessary?).

Videos about Global Warming
2014
Climate Change science is one thing, but dissemination of quality information through the media is another. Below you will find thirteen selected free videos on various topics related to Global Warming. Film and video make the often technical discussion around Climate Change more accessible and dramatic. If after reviewing the videos you are curious to know which countries are the most resistant to reason, you can see the country ranking ‘here‘.
NOAA Research (Earth System Research Laboratory): “Time history of atmospheric Carbon Dioxide from 800,000 years ago until January 2012”: ‘video 3:35‘.

Global warming: Air Temperature update 2013
2014
2013 was the 4th warmest year recorded of land Air Temperature since measurements began in 1880. See the development 1960-2013 in the diagram (the average temperature rise in 1880-1937 is set at 0°C). The last ten years of average temperature rise is the figure used in ClimatePositions.
Global Air Temperature since 1960
2013
If the increase in average global land Air Temperature in 1880-1939 is set to 0ºC, the increase in temperature in 1960-2012 is shown in the diagram. The average increase in temperature in the last decade was 1.22 ºC – this figure is included in the latest version of ClimatePositions calculations (Excel).