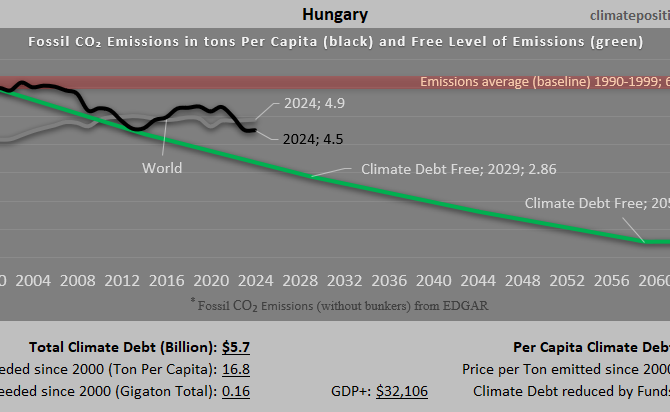
Climate Debt of Hungary 2025: $5.7 Billion or 0.06% of the Global Climate Debt (or $600 Per Capita)
/2025/ Hungary ranks 60th in Climate Debt Per Capita accumulated 2000-2025. Below are some key figures in the calculations. The diagram above shows the Fossil CO2 Emissions Per Capita and the Free Level of emissions (green). The wide straight red line shows emissions in the 1990s (baseline in the calculations).

Austria – per capita Fossil CO2 Emissions and Climate Debt
2020
Austria’s current Climate Breakdown Pricing amounts to $26.30 per tons Fossil CO2 emitted since 2000. The Climate Debt grew from $2,401 per capita in 2015 to $4,371 in 2020. Updated Rankings of 165 countries are available in the menu “Climate Debt”.
The following diagrams expose the trends of Fossil CO2 Emissions, Climate Debt, GDP(ppp-$) and Ecological Footprint without carbon.
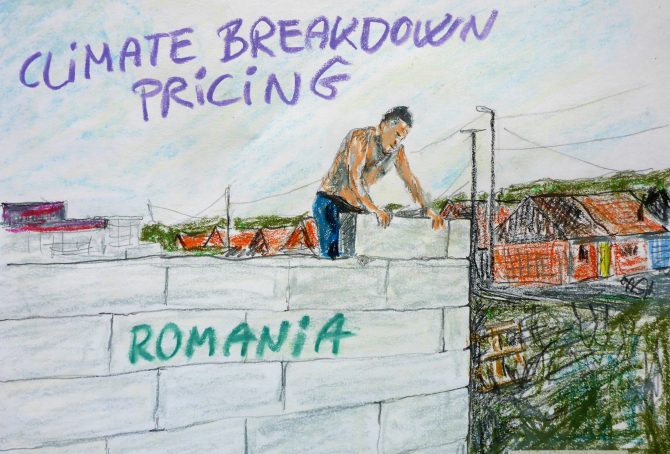
Romania – per capita Fossil CO2 Emissions and Climate Debt
2020
Romania’s current Climate Breakdown Pricing amounts to $2.78 per tons Fossil CO2 emitted since 2000. The Climate Debt grew from $65 per capita in 2015 to $235 in 2020. Updated Rankings of 165 countries are available in the menu “Climate Debt”.
The following diagrams expose the trends of Fossil CO2 Emissions, Climate Debt, GDP(ppp-$), Population Growth and Ecological Footprint without carbon.

Czech Republic – per capita Fossil CO2 Emissions and Climate Debt
2020
The current Climate Breakdown Pricing of Czech Republic amounts to $15.33 per tons Fossil CO2 emitted since 2000. The Climate Debt grew from $1,398 per capita in 2015 to $3,356 in 2020. Updated Rankings of 165 countries are available in the menu “Climate Debt”.
The following diagrams expose the trends of Fossil CO2 Emissions, Climate Debt, GDP(ppp-$) and Nuclear Power.
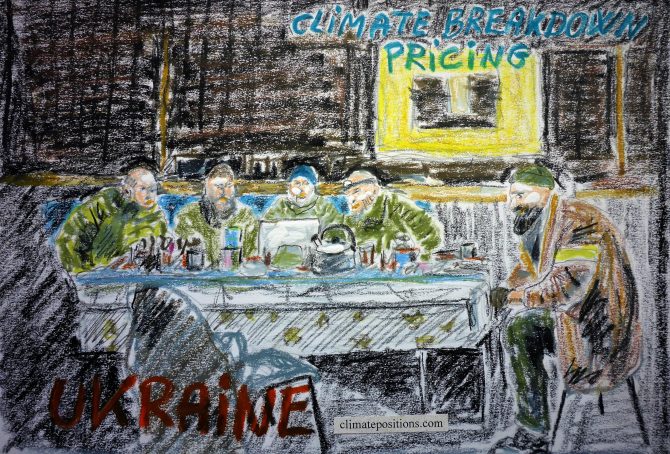
Ukraine – per capita Fossil CO2 Emissions and Climate Debt
2020
Ukraine’s current Climate Breakdown Pricing amounts to $0.82 per tons Fossil CO2 emitted since 2000. The Climate Debt grew from $44 per capita in 2015 to $105 in 2020. Updated Rankings of 165 countries are available in the menu “Climate Debt”.
The following diagrams expose the trends of Fossil CO2 Emissions, Climate Debt, GDP(ppp-$), Nuclear Power and Ecological Footprint without carbon.

Share of global Climate Debt rank 55th, 56th and 57th: Hungary, Slovakia and Serbia (combined responsible for 0.20% of Climate Debt and 0.41% of Fossil CO2 Emissions 2016)
2018
The diagram below shows ‘Share of global Climate Debt‘ in 2010, 2015 and 2017 of Hungary, Slovakia and Serbia (ranked 55th, 56th and 57th). The share of Serbia is decreasing, while the shares of Hungary and Slovakia are up and down.
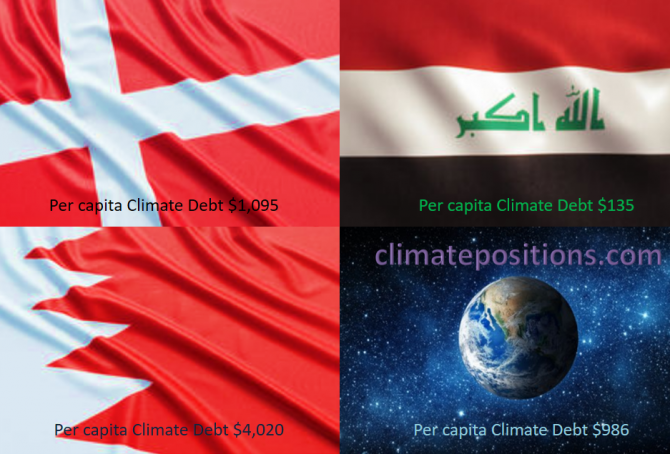
Share of global Climate Debt rank 52nd, 53rd and 54th: Denmark, Bahrain and Iraq (combined responsible for 0.24% of Climate Debt and 0.63% of Fossil CO2 Emissions 2016)
2018
The diagram below shows ‘Share of global Climate Debt‘ in 2010, 2015 and 2017 of Denmark, Bahrain and Iraq (ranked 52nd, 53rd and 54th). The shares of Bahrain and Iraq have increased significantly (Iraq had no Climate Debt in 2010), whereas Denmark’s share is relatively stable.
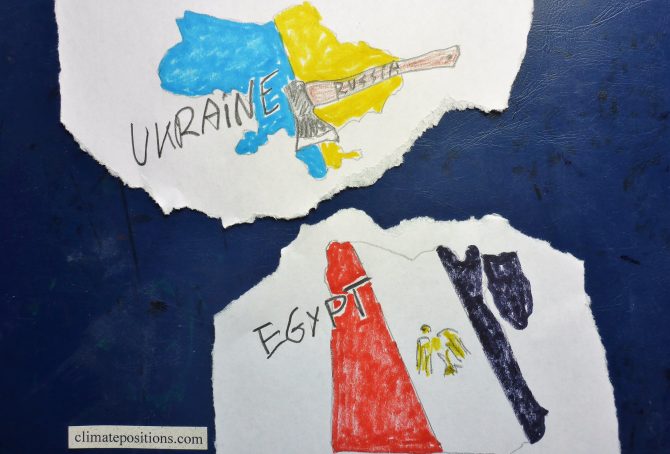
Climate change performance: Egypt vs. Ukraine
Egypt and Ukraine are the world’s 25th and 26th largest emitters of CO2 from Fossil Fuels and cement. Combined, the two countries were responsible for 1.2% of global CO2 Emissions in 2015. The following examines the ‘Indicators‘ of CO2 Emissions, GDP(ppp-$), Ecological Footprint and the Ukrainian Nuclear Power.
The diagrams below show the per capita CO2 Emissions from Fossil Fuel (without bunkers) and cement, since 2000. The green bars show the Free Emission Level¹ – the exceedance is the basis for calculating the national Climate Debt.
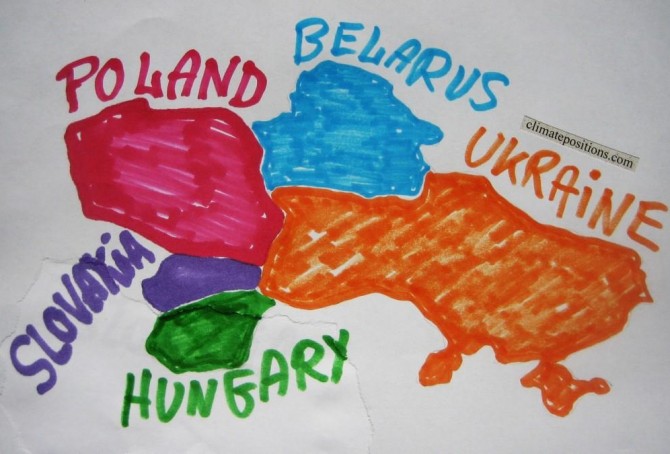
Climate change performance of Slovakia, Poland, Hungary, Belarus and Ukraine
2015
1.5% of the global population lives in Slovakia, Poland, Hungary, Belarus or Ukraine and together they emitted 2.3% of the global CO2 from fossil fuels in 2012 – the joint share of the global Climate Debt was 0.7%.
Slovakia’s accumulated Climate Debt per capita is now $640 (in 2014 the ranking was 43rd among 147 countries), Poland’s is $519 (ranked 47th), Hungary’s is $406 (ranked 54th), Belarus’ is $274 (ranked 59th) and Ukraine’s is $168 (ranked 63rd). See the ‘ranking’. The following examines the Climate Debt trends and the indicators of CO2 Emissions from fossil fuels, GDP(ppp-$) and Climate Debt as a percentage of GDP.
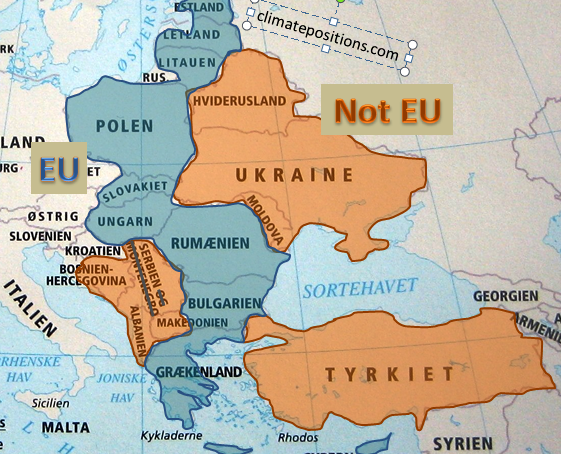
European Union “east” compared to bordering countries
2015
The ‘European Union’ (EU) is an economic and political partnership between ‘28 countries’. Around 7% of the global population lives in EU and they emit around 12% of the global CO2 from fossil fuels and are responsible of 13% of the Climate Debt in ClimatePositions. The following examines a group of 10 countries in eastern EU which joined the union between 1981 and 2007 in comparison with 8 bordering countries.