IPCC Report: Limiting Global Warming to 1.5ºC requires 45% CO2 reductions by 2030 compared to 2010 – and zero emissions by 2050 (but which countries are to reduce how much per capita?)
2018
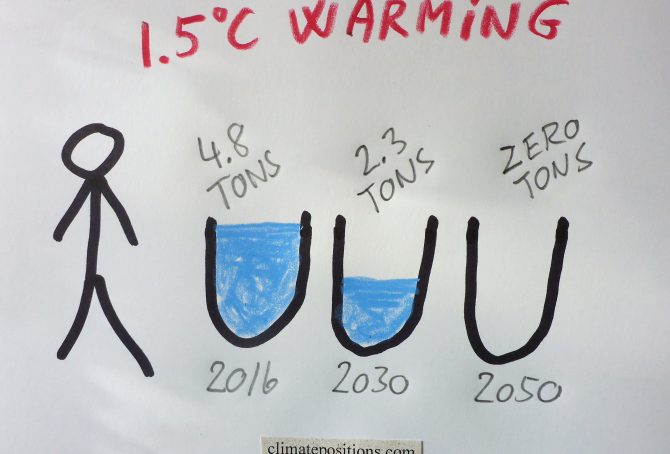
The IPCC Report ‘Global Warming of 1.5°C‘ released October 2018, finds that limiting global warming to 1.5°C would require reductions of global human-caused CO2 Emissions (carbon dioxide) of 45% by 2030 compared to 2010, and reach zero emissions around 2050¹.
However, since global Fossil CO2 Emissions increased 6.4% between 2010 and 2016, and the world population is expected to grow 1.2% annually the years to come, the required 45% global CO2 reductions by 2030, is equivalent to 53% reduction per capita by 2030 compared to 2016, or in only 14 years. In other words, an average world citizen must cut Fossil CO2 Emissions from 4.8 tons in 2016 to around 2.3 tons by 2030 and zero by 2050 (if limiting global warming to 1.5°C). Note that forest cover growth, removing CO2 from the air, etc. can substitute Fossil CO2 reductions in the IPCC scenarios².
Two studies: 26-year soil warming experiment in a mid-latitude hardwood forest (possible self-reinforcing carbon emissions feedback loop) and 12,000 years of soil carbon losses from agriculture
2017
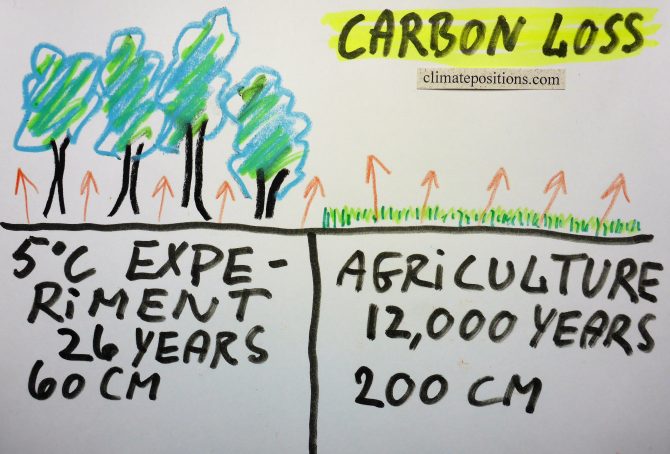
In continuation of the previous article about aboveground forest carbon losses, the following is about soil carbon losses due to warming and agriculture, respectively.
Melillo et al. performed a ‘26-year soil-warming experiment‘ in a mid-latitude mixed hardwood forest with results published October 2017 in the peer-review journal Science. Some forest areas (plots) were heated up with underground cables to 5°C above normal levels, while other forest areas were left as a control. The experiment then documented changes in soil carbon cycling in the top 60 cm and investigated the possible consequences for the climate system.
Study: Tropical forests now release twice as much carbon than they absorb
2017
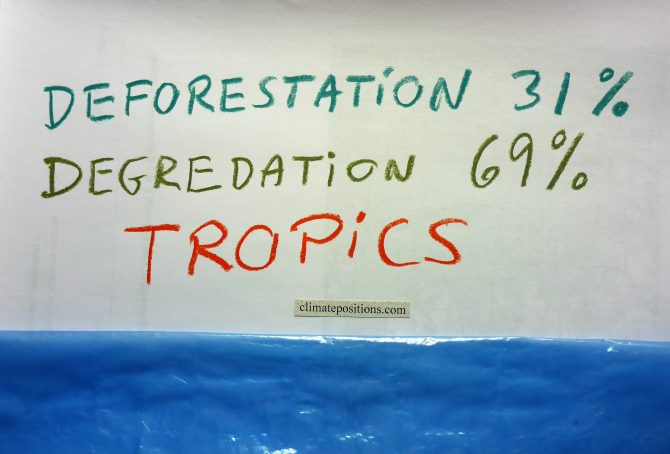
A new ‘Study‘ from ‘Woods Hole Research Center‘ and Boston University reveals tropical forests now emit twice as much carbon than they capture. This is alarming news, since forests are the only carbon capture and storage “technology” that is safe, inexpensive and immediately available.
New approach to measuring forest carbon density using 1) satellite imagery 2003-2014, 2) laser remote sensing technology and 3) field measurements, were able to capture aboveground losses in forest carbon from full-scale deforestation as well as fine-scale degradation and disturbance. The latter has previously been a challenge to the scientific community over large areas. According to the study tropical forests in Americas, Africa and Asia are now releasing 425 (± 22%) teragrams (million tons) of carbon annually¹, equivalent to more than 4% (calculated by me) of global CO2 Emissions from Fossil Fuels and industrial processes. For perspectivation, global CO2 Emissions dropped 0.34% in 2016 compared to 2015.
Climate change performance: Venezuela vs. Iraq (world’s proven reserves of oil and natural gas)
2017
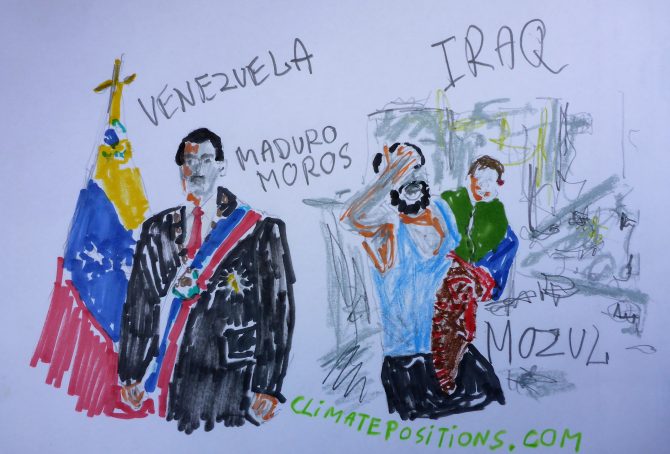
Venezuela holds the world’s largest proven oil reserves and the 8th largest proven natural gas reserves, while Iraq ranks 5th on oil and 12th on gas. Together, the two countries hold nearly 27% of the world’s proven reserves of oil and 5% of its natural gas.
The two tables below rank the 15 countries with the largest proven oil and natural gas reserves and their world shares. Combined, the 19 Fossil Fuel countries listed below hold 93% of the world’s proven oil reserves and 88% of the proven natural gas reserves. They represent 38% of the global population, 62% of the global CO2 Emissions from Fossil Fuels (2015) and 74% of the current global Climate Debt in ClimatePositions (the combined share of the global Climate Debt of the 15 countries has increased by 3.6% since 2012; see the ‘Ranking‘.
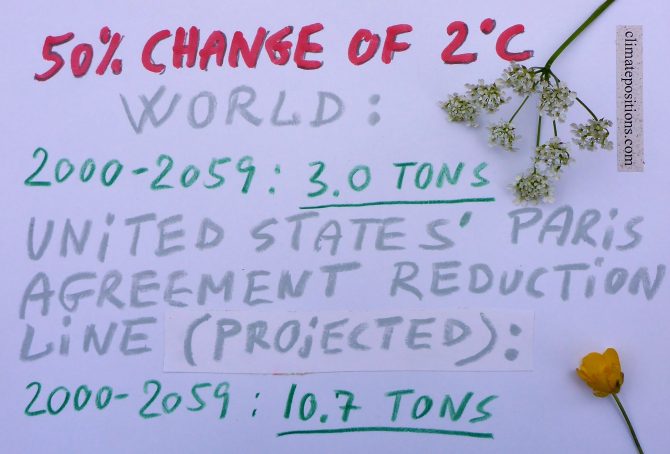
World CO2 Emissions 2000-2059: with 50% risk of 2C global warming (two per capita emission-scenarios for the United States, Denmark, Spain, China, India and Nigeria)
2017
In continuation of the previous article ‘Carbon Brief: Global Carbon Budget and CO2 Emission scenarios (50% risk of 1.5°C, 2.0°C and 3.0°C warming)‘, the following examines the per capita CO2 Emission budget 2000-2059, with a 50% risk of 2°C global warming (which of course is unacceptable). The outcome is then compared with Climate Debt Free CO2 Emission levels (in ClimatePositions) of the United States, Denmark, Spain, China, India and Nigeria, during the same 60-year period. Also, the Paris Agreements reduction commitment of the United States is put into perspective.
World Carbon Emissions from Fossil Fuels and the required reduction line in ClimatePositions (emissions of three country groups by Climate Debt)
If all 97 countries with Climate Debt (see the ‘Ranking‘), had cut national emissions as required in ClimatePositions, then World Carbon Emissions would have dropped significantly as demonstrated in the diagram below. World Carbon Emissions from Fossil Fuels (without bunker¹) and cement amounted a total of 312 GtC (Gigaton Carbon) between 1960 and 2015 … however with the required cuts, emissions would have been 270 GtC, or 14% less … and no countries would have Climate Debt.
Recent analysis² suggest a small 0.2% growth of emission in 2016 compared to 2015 – and that four more years of current emissions “would be enough to blow what’s left of the carbon budget for a good chance of keeping global temperature rise to 1.5C.” Not so smart!

The Kigali Agreement: 30-years phase-out plan for Hydrofluorocarbons (HFCs)
2016
Hydrofluorocarbons (HFCs) is a family of factory-made potent greenhouse gases, used as refrigerants in air conditioning systems in vehicles and buildings, and in aerosol propellants, solvents, fire retardants etc. HFCs were developed as replacements for Chlorofluorocarbons (CFCs) and Hydrochlorofluorocarbons (HCFCs), because these gases deplete the ozone layer. The Kigali Agreement announced mid-October, among more than 170 countries, is an extremely complicated amendment to the ozone-shielding Montreal Protocol from 1987.
HFCs, CFCs and HCFCs are all so called Fluorinated gases, or F-gases, and they are released into the atmosphere through leaks, servicing, disposal of equipment etc. The diagram below from ‘NOAA’ shows the atmospheric content since 1978 of four commonly used F-gases.

Study: Already developed fossil fuel reserves will potentially take us beyond the 2 degree warming limit
2016
A ‘Study (pdf, 60 pages)’ called “The Sky’s Limit” just released by ‘Oil Change International’ finds that already developed reserves¹ of coal, oil and gas, if extracted and burned, will take us beyond the Paris Agreement’s 2°C warming limit (and of cause far beyond the 1.5°C limit). Developed reserves is defined as currently operating fields and mines (projected to run to the end of their probable lifetimes), wells already drilled, pits that are dug, and pipelines, processing facilities, railways and export terminals already constructed. The developed reserves hold roughly 30% of the fossil fuel reserves.
The study finds that the potential CO2 Emissions from these already developed reserves – if extracted and burned – will exceed the 2°C carbon budget calculated by the Intergovernmental Panel on Climate Change (IPCC). The diagram below is copied from the study.

Report: Explaining Ocean Warming (the greatest hidden challenge of our generation)
2016
‘International Union for Conservation of Nature (IUCN)’ has recently published the report ‘Explaining Ocean Warming (pdf, 460 pages)‘ representing the most comprehensive review to date on ocean warming. IUCN is the world’s largest environmental network, harnessing the knowledge and research of around 1,300 organizations and 16,000 experts. The chapters and sections in the report tells in the scientist’s own words the scale and nature of changes being driven by ocean warming, often in association with other stressors such as ocean acidification and oxygen reductions. The following is an adapted summary of the report’s conclusions and recommendations.
Giving up on future generations is real (about COP Submissions 2015)
2015
COP Submissions with intended national emission targets of 44 countries¹, responsible for 70% of the global CO2 Emissions from fossil fuels, are now available for study. Among the seven largest emitters only India’s submission is still missing. China, the world’s largest emitter, intends to reach its maximum emissions by 2030 (maybe earlier) and then reduce … which leaves global scenarios open to assumptions. The calculations in this article are based on 10% and 30% increase of the Chinese emissions by 2030, compared to 2013.
Greenhouse gas emissions and COP negotiation strategies
2015
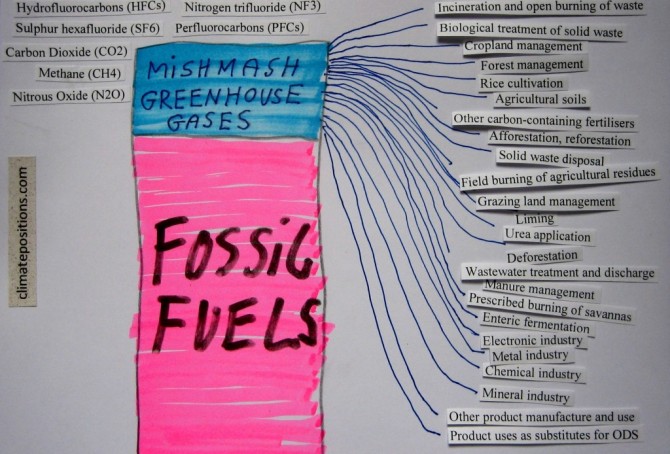
This article is about the different greenhouse gases and what appears to be a delaying COP negotiation strategy on the road to a potentially very costly global greenhouse gas reduction agreement. The essential climate change problem (as I see it) is the greenhouse gas emissions related to fossil fuels. As an example, around 82% of all anthropologic greenhouse gases in the United States are related to coal, oil or natural gas. This measure includes emissions of three different greenhouse gases: carbon dioxide (CO2), methane (CH4) and nitrous oxide (N2O).
Since 1990 the atmospheric concentrations of these three gases has increases by around 13% (carbon dioxide), 7% (methane) and 6% (nitrous oxide). However, the three gases are also emitted from other sources than fossil fuels, including many natural sources … in addition, the potent synthetic fluorinated gases (F-gases) are not related to fossil fuels at all. On a global scale the overall picture is extremely complicated. Note that water vapor is the dominant greenhouse gas among all, but it is not considered relevant to the anthropogenic global warming – and therefore water vapor is usually not regarded as a greenhouse gas.
Greenhouse gas submissions of the United States, the European Union and Russia, by March 2015
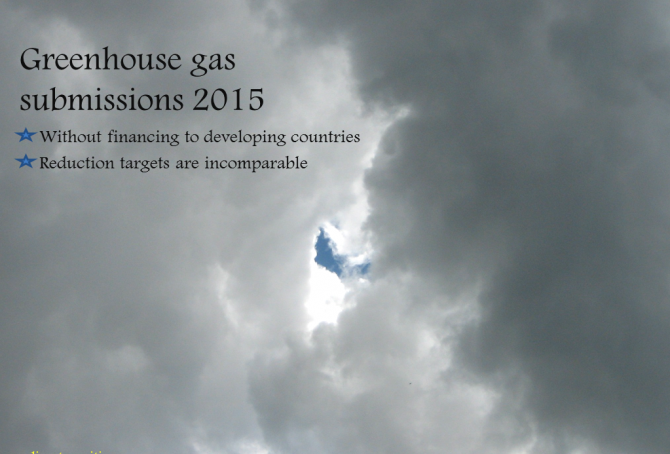
Submissions of 33 countries (including ‘EU-28‘) with “intended nationally determined” greenhouse gas reductions have so far reached the United Nation’s ‘COP process website’. The greenhouse gas reductions proclaimed in the submissions include, besides carbon dioxide (CO2), gases such as methane, nitrous oxide, perfluorocarbons, hydrofluorocarbons, sulphur hexafluoride and nitrogen trifluoride – and changes in land-use and forestry. This mixture of different sources together with different parties, base years and target years, make the intended greenhouse gas reductions both muddy and incomparable between nations. None of the submissions so far include future financing to developing countries.
The following compares the submissions of the United States, the European Union (EU-28) and Russia – combined these 30 countries were responsible of 34% of the global carbon dioxide emissions from fossil fuels in 2012.
ExxonMobil: The Outlook for Energy 2015 … 2040 (Planet Exxon!?)
2015
‘Exxon Mobil Corporation’ from Texas, the United States is, quote: “committed to being the world’s premier petroleum and petrochemical company.” However, based on estimates of the potential carbon dioxide emissions from the proven reserves of oil and gas underground, ExxonMobil is only the 4th largest company in the world after Gazprom, Rosneft (both Russia) and PetroChina (read this ‘article’).
Since the United Nations has decided to keep the rise in global temperature below 2°C and consequently only between 8% and 34% of the proven fossil fuel reserves can be extracted and burned over the next 40 years. A recent ‘study in Nature‘ suggest that, globally, 33% of oil reserves, 50% of gas reserves and over 80% of current coal reserves should remain unused from 2010 to 2050 in order to meet the target of 2°C (also read the article ‘Divestment from Fossil Fuel Companies’). It will be interesting to see how companies such as ExxonMobil meet this moral challenge. The following highlight some forecasts from ExxonMobil’s ‘Outlook for energy 2015: A View to 2040’ (76 pages).
COP20 in Lima: Derailed negotiations and depressed scientists
2014
Since ‘COP1 in Berlin’ in 1995 the global CO2 Emissions from fossil fuels have increased by 50% (in addition to increased greenhouse gas emissions from deforestation, cement production, melting permafrost, etc.). The purpose of COP1, COP2, COP3, COP4, COP5, COP6, COP7, COP8, COP9, COP10, COP11, COP12, COP13, COP14, COP15, COP16, COP17, COP18 and COP19 were to reduce dangerous greenhouse gases and counteract global warming. The current COP20 in Lima builds on twenty years of mushrooming in a flawed system without tools to secure meaningful negotiations and reject derailments caused by powerful nations such as the United States and China. Meanwhile, depression¹ is spreading from climate scientists to larger parts of the planet’s population.
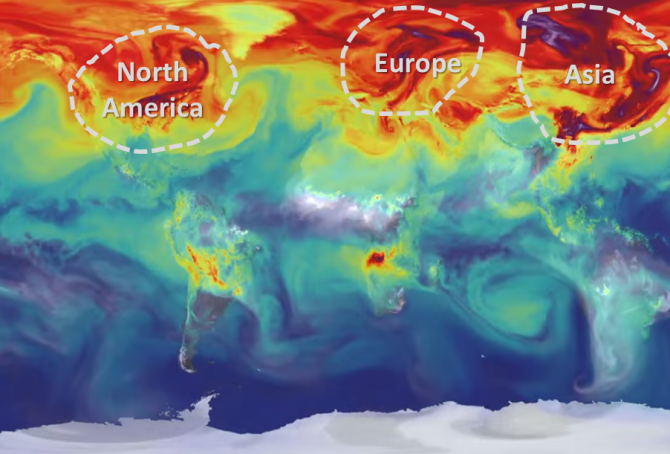
NASA video showing one year of carbon dioxide emissions swirling in the atmosphere
2014
‘NASA’ has released this simulated ‘video 3:10’ showing the global carbon dioxide emissions in 2006 in three minutes. The simulation illustrates plumes of CO2 swirling and shifting as winds disperse the emissions away from its sources. The animation also shows the swings in concentrations as the growth cycle of plants and trees changes with the seasons. ‘CO Emissions’ (monoxide) from forest fires are also visualized in the video.
Since 2006 the global CO2 Emissions from fossil fuels have increased by 14% and the CO2 content in the atmosphere has increased from 382 ppm in 2006 to 396 ppm in 2013. Below are ranked the twenty countries¹ with the largest CO2 Emissions per capita in 2012, with the climate dept per capita and the percentage of the global Climate Contribution (climate debt). The calculations of climate debt and the data of all countries are available in the menu ‘Calculations (Excel)’.
Carbon cycle for beginners
2014
Carbon is one out of 118 known chemical elements and symbolized with a “C” (as in CO2). Carbon is globally spread and essential for all life (18.5% of the human body mass is carbon). However, only around 0.003% of the carbon on earth is within living organisms and possibly the double occur in ancient organic deposits of coal, oil, gas and peat. Pure carbon can be chemically composed several ways, for example in the form of diamond, graphite, graphene or simply as amorphous carbon. See this short instructive video: ‘Carbon – Periodic Table of Videos (10:02)’. Carbon forms almost ten million known compounds with other chemical components, which is more than any other chemical element. Carbon dioxide (or CO2) is one compound, composed of one atom of carbon (C) and two atoms of oxygen (O2). Methane (or CH4) is another, composed of one atom of carbon and four atoms of hydrogen.