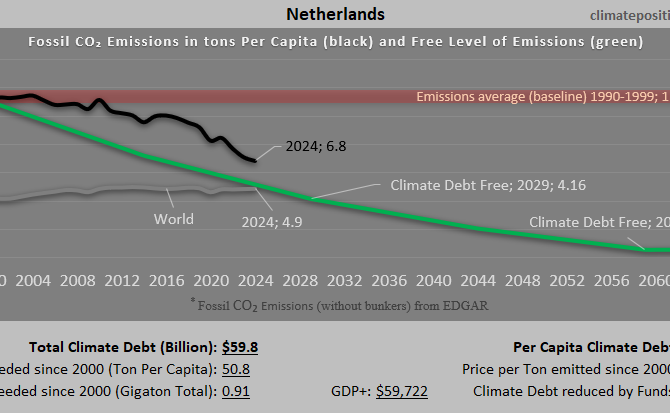
Climate Debt of Netherlands 2025: $60 Billion or 0.65% of the Global Climate Debt (or $3326 Per Capita)
/2025/ Netherlands ranks 19th in Climate Debt Per Capita accumulated 2000-2025. Below are some key figures in the calculations. The diagram above shows the Fossil CO2 Emissions Per Capita and the Free Level of emissions (green). The wide straight red line shows emissions in the 1990s (baseline in the calculations).
Netherlands: Per Capita Climate Debt $3,770 (Ranked 17) – Fossil CO2 Emissions
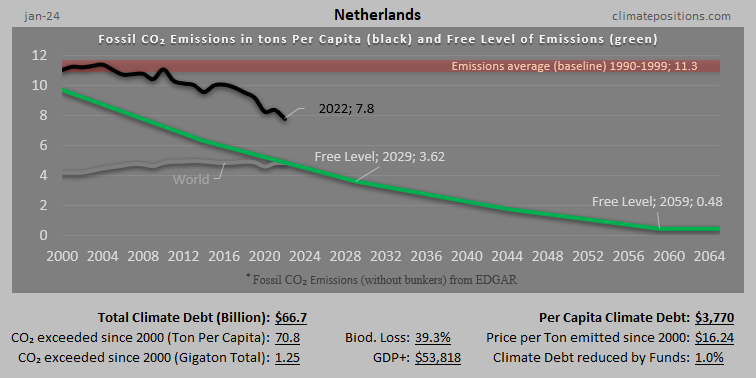
In 2024, Netherlands is responsible for 0.85% of the Global Climate Debt accumulated since 2000. Below are some key figures in the calculations.

Belgium – per capita Fossil CO2 Emissions and Climate Debt
2020
Belgium’s current Climate Breakdown Pricing amounts to $22.93 per tons Fossil CO2 emitted since 2000. The Climate Debt grew from $2,025 per capita in 2015 to $4,490 in 2020. Updated Rankings of 165 countries are available in the menu “Climate Debt”.
The following diagrams expose the trends of Fossil CO2 Emissions, Climate Debt, GDP(ppp-$), Nuclear Power and Ecological Footprint without carbon.

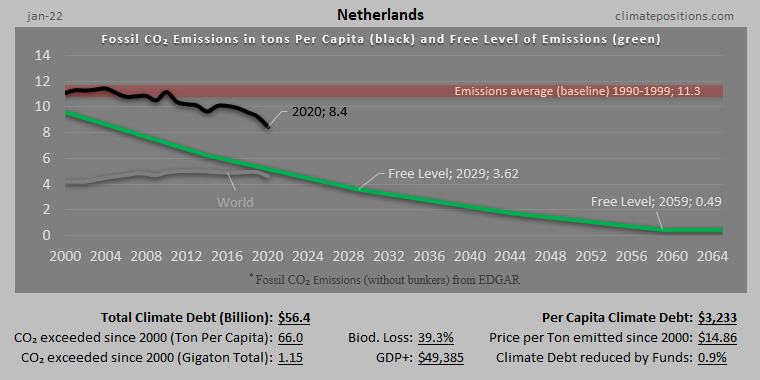
The Netherlands – per capita Fossil CO2 Emissions and Climate Debt
2020
The current Climate Breakdown Pricing of the Netherlands amounts to $24.59 per tons Fossil CO2 emitted since 2000. The Climate Debt grew from $2,316 per capita in 2015 to $4,918 in 2020. Updated Rankings of 165 countries are available in the menu “Climate Debt”.
The following diagrams expose the trends of Fossil CO2 Emissions, Climate Debt, GDP(ppp-$) and Ecological Footprint without carbon.

United Kingdom – per capita Fossil CO2 Emissions and Climate Debt
2020
The current Climate Breakdown Pricing of the United Kingdom amounts to $11.17 per tons Fossil CO2 emitted since 2000. The Climate Debt grew from $871 per capita in 2015 to $1,614 in 2020. Updated Rankings of 165 countries are available in the menu “Climate Debt”.
The following diagrams expose the trends of Fossil CO2 Emissions, Climate Debt, GDP(ppp-$), Nuclear Power and Ecological Footprint without carbon.
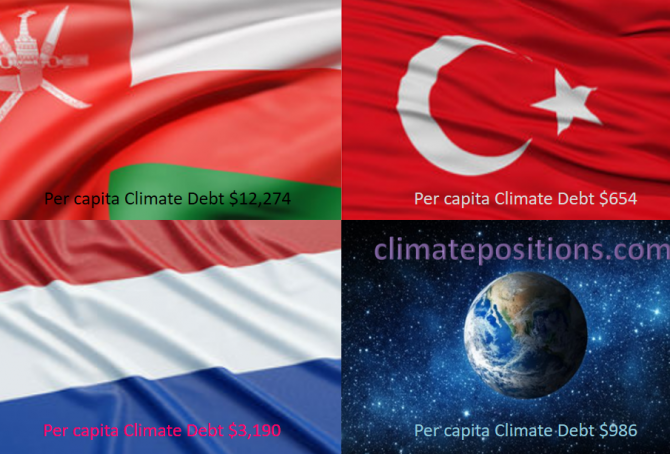
Share of global Climate Debt rank 19th, 20th and 21st: Oman, Netherlands and Turkey (combined responsible for 2.2% of Climate Debt and 1.7% of Fossil CO2 Emissions 2016)
2017
The diagram below shows ‘Share of global Climate Debt‘ in 2010, 2015 and 2017 of Oman, Netherlands and Turkey (ranked 19th, 20th and 21st). The share Netherlands is decreasing steadily, whereas Turkey’s is increasing.
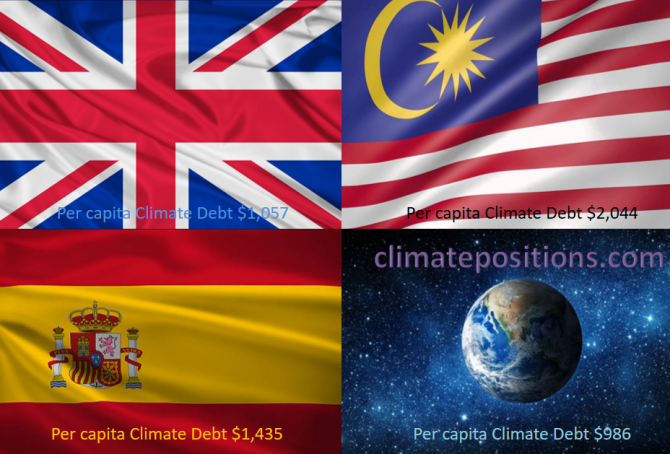
Share of global Climate Debt rank 16th, 17th and 18th: The United Kingdom, Spain and Malaysia (combined responsible for 2.8% of Climate Debt and 2.5% of Fossil CO2 Emissions 2016)
2017
The diagram below shows ‘Share of global Climate Debt‘ in 2010, 2015 and 2017 of the United Kingdom, Spain and Malaysia (ranked 16th, 17th and 18th). The shares of the United Kingdom and Spain are decreasing, while the Malaysian share is increasing.
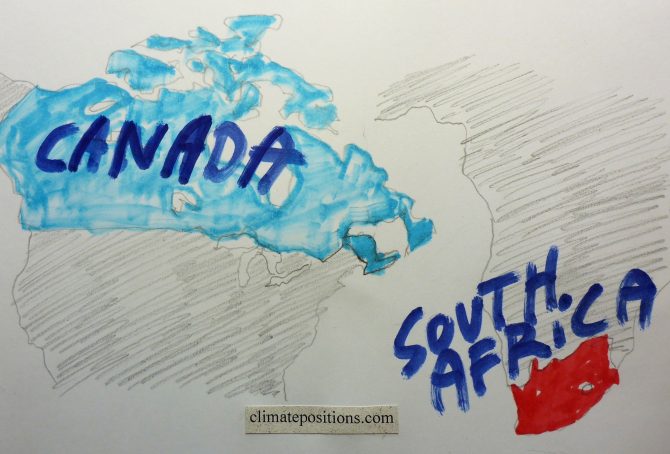
Climate change performance: Canada vs. South Africa
2017
Canada and South Africa are the world’s 13th and 14th largest emitters of CO2 from Fossil Fuels and cement. Combined, the two countries were responsible for 2.6% of world CO2 Emissions in 2015. The following examines the ‘Indicators‘ of CO2 Emissions, GDP(ppp-$), Ecological Footprint and Nuclear Power.
The diagrams below show the per capita CO2 Emissions from Fossil Fuel (without bunkers) and cement, since 2000. The green bars show the Free Emission Level¹ – the exceedance is the basis for calculating the national Climate Debt. Canada’s emissions from coal decreased by 41.3% between 2000 and 2014 (coal caused 13% of the CO2 Emissions from Fossil Fuels in 2014). South Africa’s emissions from coal increased by 6.4% between 2010 and 2014 (coal caused 83% of the CO2 Emissions from Fossil Fuels in 2014).

Climate Debt: Norway ranks 9th (performance of top twenty from Human Development Index)
The so called ‘Human Development Index 2015’ (UN) ranks Norway 1st among 188 countries. The index is based on 1) Life expectancy at birth, 2) Expected years of schooling, 3) Mean years of schooling and 4) Gross national income (GNI) per capita. However, the wealthy Scandinavian oil state ‘Ranks‘ 9th among 148 countries on Climate Debt per capita. Norway is in other words a highly human developed demolisher of the climate, one might say! The following examines the climate performance of Norway in comparison with the other top five countries from Human Development Index: Australia, Switzerland, Denmark and Netherland.
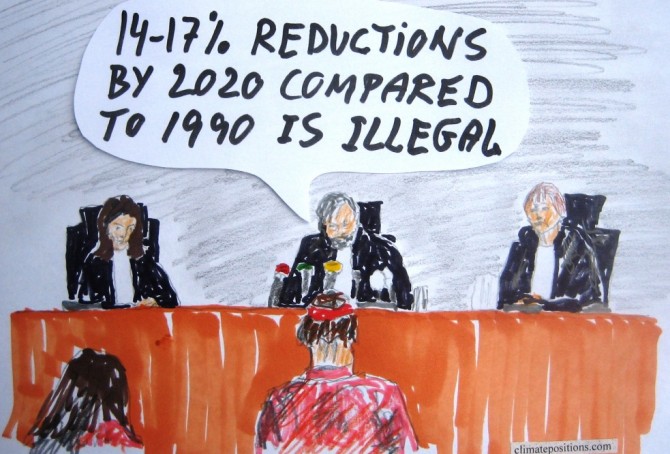
Court has ordered Netherlands to reduce carbon emissions by 25% within five years in the world’s first climate change liability lawsuit
2015
In the first climate change liability lawsuit brought under human rights and tort law, a court in Hague today concluded that the threat posed by global warming was severe and acknowledged by the government of Netherland in international treaties. Therefore the government’s climate policy was ruled illegal and the three judges ordered the government to reduce carbon emissions by at least 25% within five years. Government’s plans to reduce carbon emissions by just 14-17% by 2020 compared to 1990 were rejected as inadequate to protect the citizens from the effects of climate change.
The lawsuit was brought by The Dutch ‘Urgenda’ Foundation. Read the article ‘Dutch government ordered to cut carbon emissions in landmark ruling’ from The Guardian and the article ‘Oslo Principles on obligations to reduce climate change (time for legal sanctions)‘. A similar lawsuit is underway in the neighboring country of Belgium.
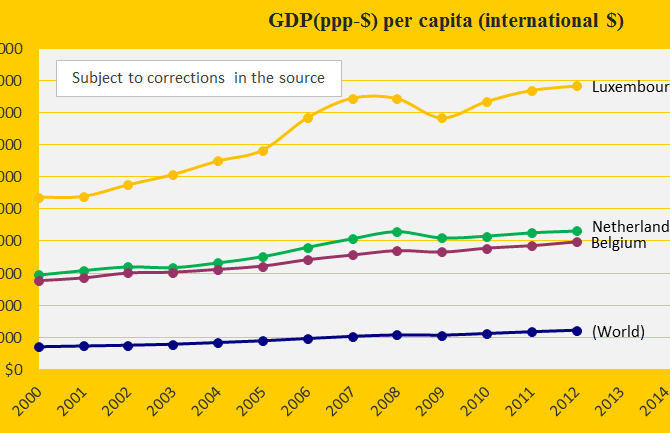
Miserable climate performance of Netherlands, Belgium and Luxembourg
2014
Netherlands and Belgium are rich countries and the little tax haven Luxembourg is extremely rich – see the diagram with the GDP(ppp) since 2000 compared with the world average. Netherlands and Belgium were 9th and 10th worst performing countries out of 145 in Climate Positions 2010. See the full ranking in the menu “Contributions / Per Capita US$ Rank”. Due to lack of data on Ecological Footprint Luxembourg is not included in the ranking. However, if the missing data is estimated at the same level as the neighboring countries, then Luxembourg would be 4th on the list. Together, the three countries are the vanguard of climate destruction in the European Union (EU).
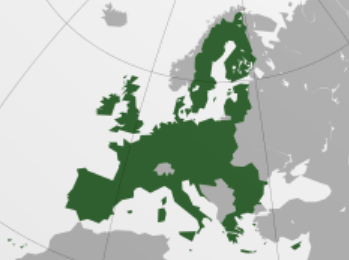
European Union perform poorly
2013
The map (from Wikipedia) shows the very different countries in ‘European Union‘ (EU). As a whole EU perform poorly on the climate challenge and only Romania was Contribution Free in ClimatePositions 2010. Both Netherlands and Belgium are among the top 10 worst performing countries in the world. Se the EU rank at the end and the global ranking in the menu “Contributions/Per Capita US$ Rank”).