Global indicator updates: Land-Ocean Air Temperature, Sea Level, CO2 in the Atmosphere and Population
2019
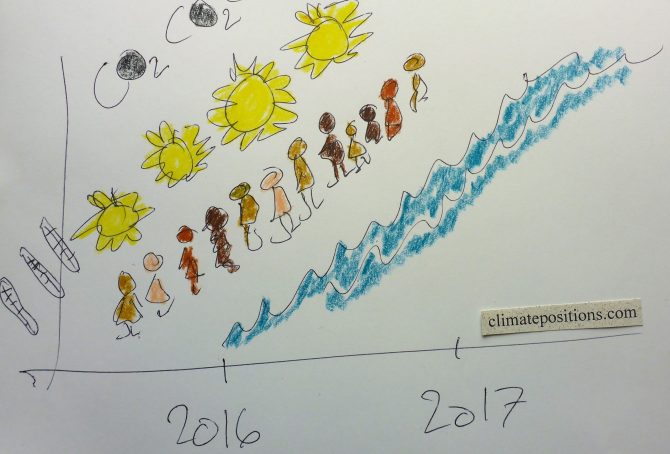
The four global Indicators: 1) Land-Ocean Air Temperature, 2) Sea Level, 3) CO2 in the Atmosphere and 4) Population, have all been updated in ClimatePositions. Combined, the updates resulted in significant increases in national Climate Debts (the first two, due to adjustments of the national GDP-Factor and the last two, due to adjustments of the global Fossil CO2 Emission target). As an example, India’s Climate Debt increased from $0.30 per capita (rounds to zero), to $2 per capita, only because of the global Indicator updates.
Diagrams with the four global Indicators are shown below.
Global indicator updates: Land-Ocean Temperature, Sea Level, CO2 in the Atmosphere and Population
2018
The four global Indicators: Land-Ocean Temperature, Sea Level, CO2 in the Atmosphere and Population have been updated in ‘ClimatePositions (Excel)‘. Combined, the updates resulted in significant increases in national Climate Debts. Land-Ocean Temperature and Sea level due to adjusting the national GDP-Factor, while CO2 in the Atmosphere and Population due to adjusting the global Fossil CO2 Emission Target.
Diagrams with the four global Indicators are shown below [diagram were replaced 15-02-2018].
Global Indicator Updates 2016: Sea Level, Population and CO2 Content in the atmosphere
2017
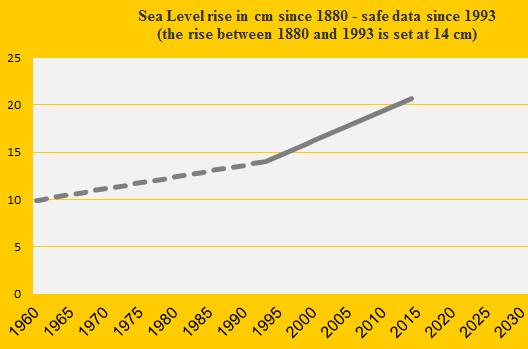
The estimated annual global Sea Level rise since 1993 increased from 3.3 mm (±0.4 mm) in 2015 to 3.4 mm (±0.4 mm) in 2016. The increase suggests an accelerating rate of Sea Level rise, which is illustrated in the diagram below. The growing volume of the oceans is caused by two effects of global warming: melting ice and warmer oceans. In ClimatePositions the Sea Level rise between 1880 and 1993 is set at 1.2 mm annually, or 14 cm during the 113-year period. The total estimated Sea Level rise between 1880 and 2016 adds up to 21.82 cm and this figure is used as an ‘Indicator‘ in ClimatePositions.
The Sea Level rise between 2004 and 2016 is shown below (Sea Level 1880 and 1993 is set at 0 cm and 14 cm, respectively) – the unscientific polynomial trend line projects the scary tendency by 2100.
Update 2015: Sea Level rise slowly accelerates
During 2015 the average estimated rate of global Sea Level rise since 1993 increased from 3.2 mm (±0.4 mm) annually to 3.3 mm (±0.4 mm). This indicates a slowly continually accelerating rate of Sea Level rise. In ClimatePositions the Sea Level rise between 1880 and 1993 is set at 1.2 mm annually, or 14.00 cm in total, and combined this adds up to a total estimated Sea Level rise between 1880 and 2015 of 21.26 cm (this figure is used in ClimatePositions).
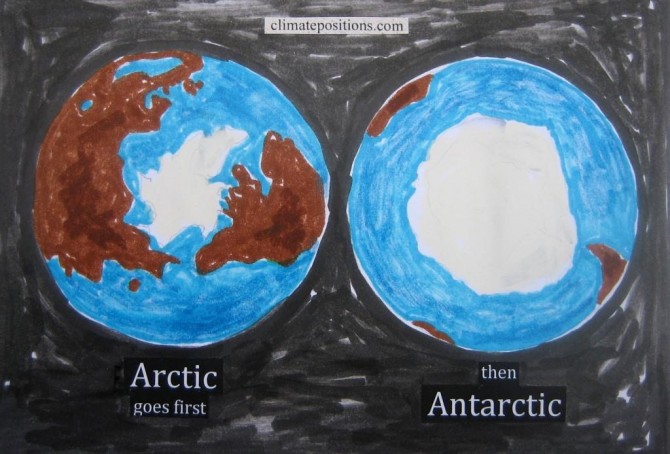
Sea level rises 58 m if all fossil fuels are extracted and burned
2015
A new ’simulation-study from Postdam Institute for Climate Impact Research’ shows that the Antarctic ice sheet would melt, causing the world’s sea level to rise about 58 m, if all the world’s resources of coal, oil and gas are extracted and burned. The following highlight some of the assumptions and outcomes of the study and besides visualize 30 m and 60 m sea level rise in fourteen of the world’s twenty largest cities (Tokyo, New York City, Seoul, Mumbai, Karachi, Osaka, Shanghai, Beijing, Calcutta, Cairo, London, Dhaka, Paris and Rio de Janeiro).
Sea Level update 2014
2015
The estimated global Sea Level increase rate is unchanged 0.32 cm annually since 1993. The increase between 1880 and 1993 is set at 14.00 cm. This adds up to a total Sea Level rise from 1880 to 2014 at 20.72 cm – this figure is used in ClimatePositions.
Videos about Global Warming
2014
Climate Change science is one thing, but dissemination of quality information through the media is another. Below you will find thirteen selected free videos on various topics related to Global Warming. Film and video make the often technical discussion around Climate Change more accessible and dramatic. If after reviewing the videos you are curious to know which countries are the most resistant to reason, you can see the country ranking ‘here‘.
NOAA Research (Earth System Research Laboratory): “Time history of atmospheric Carbon Dioxide from 800,000 years ago until January 2012”: ‘video 3:35‘.
Sea Level update 2013
2014
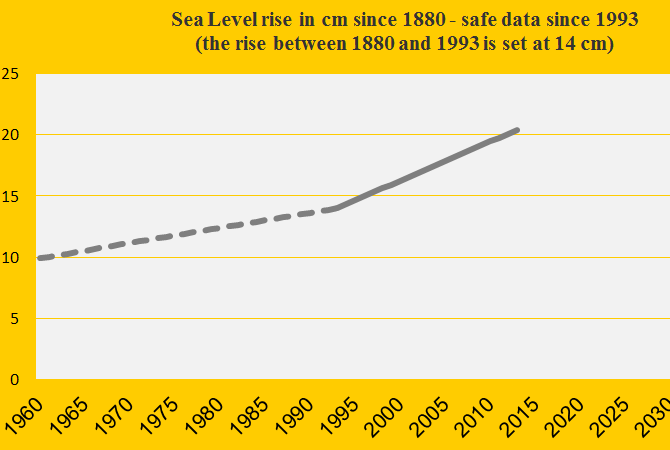
The measurements of global Sea Level are very complicated and end up in a single figure for average annual Sea Level rise since 1993. From 2012 to 2013, the increase rate is unchanged 0.32 cm annually (since 1993). The total increase between 1880 and 1993 is set at 14 cm (with uncertainty). This adds up to a total Sea Level rise from 1880 to 2013 at 20.40 cm – the figure used in ClimatePositions. See the development in Sea Level 1960-2013 in the diagram (the level in 1880 is set at 0).
Climate performance: Canada versus United States
2013
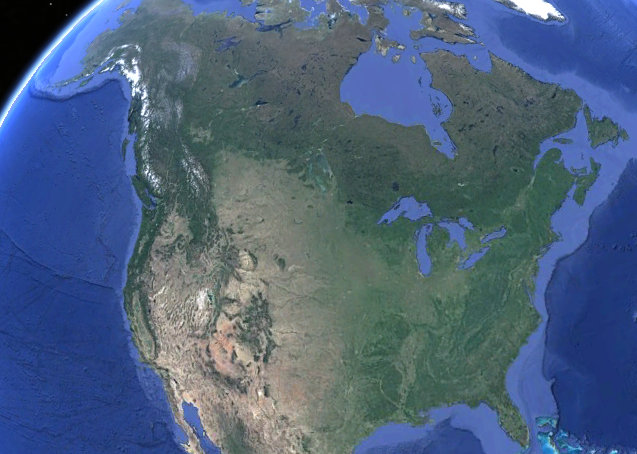
North America’s 7% of the Global Population accounted for 47% of the global Climate Contributions (climate debt) in ClimatePositions 2010. Canada was the 8th worst performing country out of 145 and United States was the 7th. Most indicators on Canada and United States follow the same trends over time, some with slightly different levels, however.
Obama hoping for change
2013
United States is not only notorious for illegal surveillance, waterboarding, illegal wars and imprisonments without trial – the country is also primarily responsible for climate change. While the oceans are rising Barak Obama is hoping for change (see the Sea Level rise in the diagram below).
Global Sea Level 1993-2012
2013
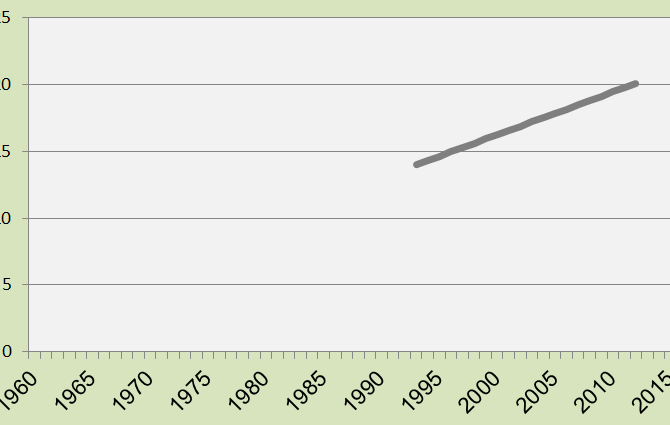
The diagram shows the global Sea Level rise between 1993 and 2012. Annually the average increase was 3.2 mm (a total of 6.08 cm in 19 years). The increase between 1880 and 1993 is set to 14 cm (uncertain data). The annually updated Sea Level affects the national Climate Contributions in ClimatePositions.
