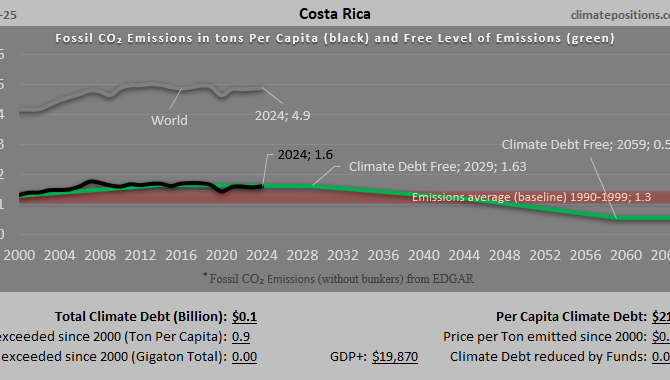
Climate Debt of Costa Rica 2025: $106 Million or 0.0011% of the Global Climate Debt (or $21 Per Capita)
/2025/ Costa Rica ranks 96th in Climate Debt Per Capita accumulated 2000-2025. Below are some key figures in the calculations. The diagram above shows the Fossil CO2 Emissions Per Capita and the Free Level of emissions (green). The wide straight red line shows emissions in the 1990s (baseline in the calculations).

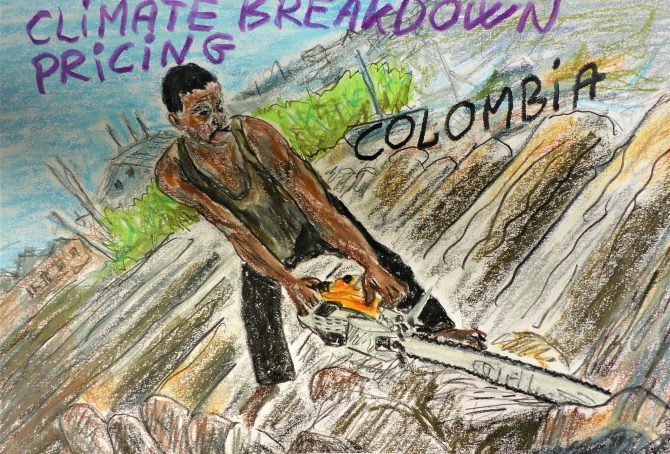
Colombia – per capita Fossil CO2 Emissions (zero Climate Debt)
2020
Although Colombia’s accumulated Climate Debt is zero, the country is the world’s 45th largest emitter of Fossil CO2.
The following diagrams expose the trends of Fossil CO2 Emissions, GDP(ppp-$), Forest Cover, Primary Forest and Environmental Performance.
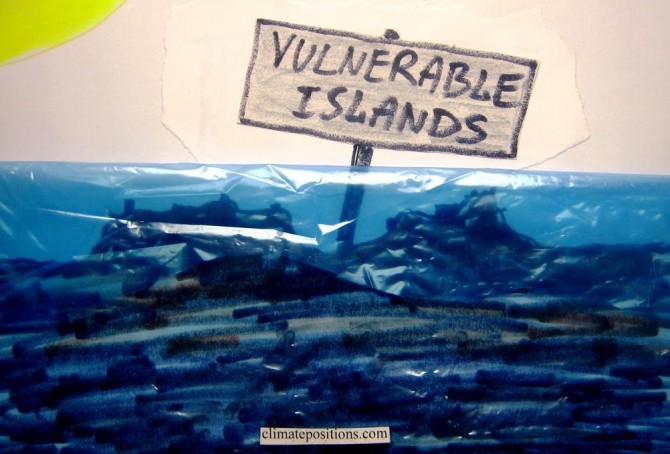
New at COP21: The Vulnerable Twenty Group (V20)
2015
Prior to COP21 in Paris in December twenty countries most at risk from the effects of global warming has formed ‘The Vulnerable Twenty Group (V20)’. Unified, the new group hopes for greater access to climate finance for adaptation and mitigation. The twenty countries representing almost one-tenth of the world’s population are: Bangladesh, Philippines, Ethiopia, Vietnam, Tanzania, Kenya, Afghanistan, Nepal, Ghana, Madagascar, Rwanda, Costa Rica, Bhutan, Timor-Leste, Maldives, Barbados, Vanuatu, Saint Lucia, Kiribati and Tuvalu. The first thirteen on the list have full data in ClimatePositions and they are all Contribution Free (no Climate Debt) among 147 countries (see the ‘ranking’). The last seven are examined below in terms of climate change performance.
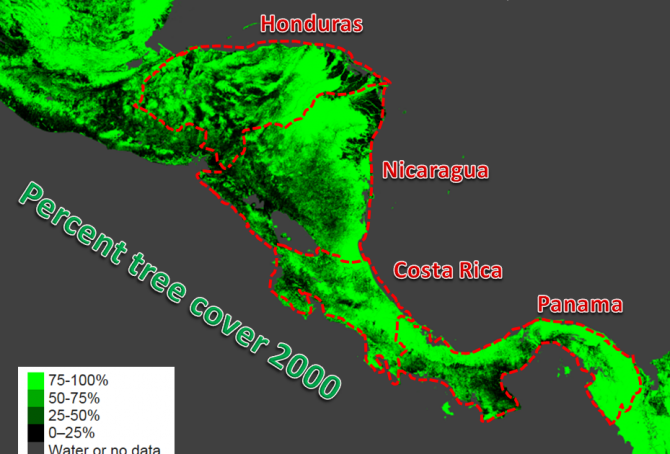
Climate change performance of Panama, Honduras, Costa Rica and Nicaragua
2015
0.32% of the global population lives in Panama, Honduras, Costa Rica or Nicaragua, and together they emitted 0.12% of the global CO2 from fossil fuels in 2012. Panama’s updated Climate Debt per capita is $325 and the Honduran is $18. Costa Rica and Nicaragua are both Contribution Free. See the ‘ranking’ by November 2014. The following examines the indicators of CO2 Emissions (carbon dioxide from fossil fuels), Forests and GDP(ppp-$).
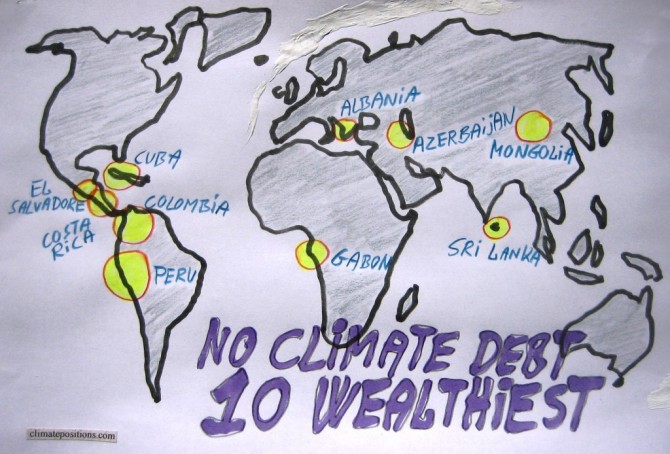
The ten wealthiest countries without any Climate Debt
2015
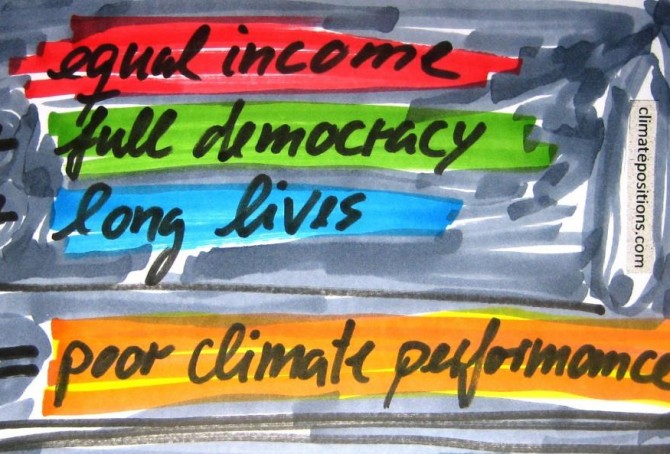
Among the 147 countries with full data in ClimatePositions 65 are Contribution Free (no Climate Debt). See the ‘ranking’. The table in this article ranks (from 1 to 10) the ten wealthiest Contribution Free countries by the following eight indicators:
- Per capita GDP(ppp-$) (1 = wealthiest)
- Income Equality (1 = most equal)
- Per capita CO2 Emissions from fossil fuels (1 = lowest emissions)
- Democracy Index (1 = most democracy)
- Environmental Performance (1 = best performance)
- Life Expectancy by birth (1 = longest lives)
- Per capita Ecological Footprint without carbon (1 = smallest footprint)
- Primary Forests as a percentage of the total land area (1 = largest percentage)
Read the comments below the table.
Income Equality, Life Expectancy, Democracy Index … and Climate Contributions
2014
123 out of 145 countries with full data in ClimatePositions are included in an inventory of Income Equality (see the source at the bottom), which shows how much the 10% poorest earns compared to the 10% richest. 53 out of the 123 countries are Contribution Free (no climate debt) in ClimatePositions 2010 and 70 countries are not.
The table below shows the difference between the two groups of countries in terms of Income Equality, Life Expectancy, number of Full Democracies and number of Authoritarian Regimes. To clarify the trend the 20 countries with the largest Climate Contributions appear at the top of the table. The 123 countries represent 95% of the world population.

Impressive performance by Costa Rica
2013
In 2010 ‘Costa Rica‘ was the only Contribution Free, full democratic country with a GDP(ppp-$) above the global average. The diagram above shows the national CO2 Emissions per capita (the black bars) and the Contribution Free Levels of CO2 Emissions (the green bars) in 2000-2011. Note that Costa Rica could have increased CO2 Emissions (carbon dioxide) from 1.2 ton CO2 per capita in 2000 to 1.9 tons in 2011 and still be Contribution free, due to other fine indicator values.