Global Indicator Updates 2025: Global Temperature, CO2 content in the Atmosphere and Population
/2025/ The three Global Indicators included in the calculations of Climate Debt in ClimatePositions are: 1) Global Temperature, 2) CO2 content in the atmosphere, and 3) Global Population. In 25 years these three indicators have caused a decrease in the Fossil CO2 Emission Reduction Target from 1.00 ton to 0.55 ton – by 2059.
2025: New Climate Debt calculations and Rankings (168 countries with full data)
/2025/ Updated Climate Debt calculations and Rankings are available in the main menus above. The indicators of Biodiversity Loss and Nuclear Power are no longer included in the calculations.
2024: Ranking updates now available (Global Climate Debt increases by 1.4 trillion dollars in two years)
/2024/ A new version of ClimatePositions Calculation Excel is now available in the menu. Updated rankings by country are also available in the menus.
In January 2024, the Global Climate Debt (accumulated since 2000) was 7.8 Trillion dollars, which is an increase of 700 Billion dollars annually since 2022. This reflects the tragic fact that global CO2 Emissions from Fossil Fuels were 6.7% higher in 2022 than in 2020.
Update: Climate Debt Ranking by country (165 countries)
2020
The accumulated Climate Debt of 165 countries has been entered the menu “Climate Debt” (Rankings 2020) and the sub-menu Calculation (Excel). The coming months the climate breakdown responsibility of a large number of countries will be examined.
Global indicator updates: Land-Ocean Air Temperature, Sea Level, CO2 in the Atmosphere and Population
2019
The four global Indicators: 1) Land-Ocean Air Temperature, 2) Sea Level, 3) CO2 in the Atmosphere and 4) Population, have all been updated in ClimatePositions. Combined, the updates resulted in significant increases in national Climate Debts (the first two, due to adjustments of the national GDP-Factor and the last two, due to adjustments of the global Fossil CO2 Emission target). As an example, India’s Climate Debt increased from $0.30 per capita (rounds to zero), to $2 per capita, only because of the global Indicator updates.
Diagrams with the four global Indicators are shown below.

Indicator update: Environmental Performance Index 2018
2018
The Environmental Performance Index 2018 ranks 180 countries on 24 performance indicators across 10 issue categories¹ covering A) Environmental Health (40%), which measures threats to human health, and B) Ecosystem Vitality (60%), which measures natural resources and ecosystem services. Over the years the Environmental Performance Index (EPI) has also identified a number of severe data gaps² that hamper sustainability goals.
Global indicator updates: Land-Ocean Temperature, Sea Level, CO2 in the Atmosphere and Population
2018
The four global Indicators: Land-Ocean Temperature, Sea Level, CO2 in the Atmosphere and Population have been updated in ‘ClimatePositions (Excel)‘. Combined, the updates resulted in significant increases in national Climate Debts. Land-Ocean Temperature and Sea level due to adjusting the national GDP-Factor, while CO2 in the Atmosphere and Population due to adjusting the global Fossil CO2 Emission Target.
Diagrams with the four global Indicators are shown below [diagram were replaced 15-02-2018].
Updated Climate Debt of 163 countries (per capita Fossil CO2 Emissions 1990-2016)
2017
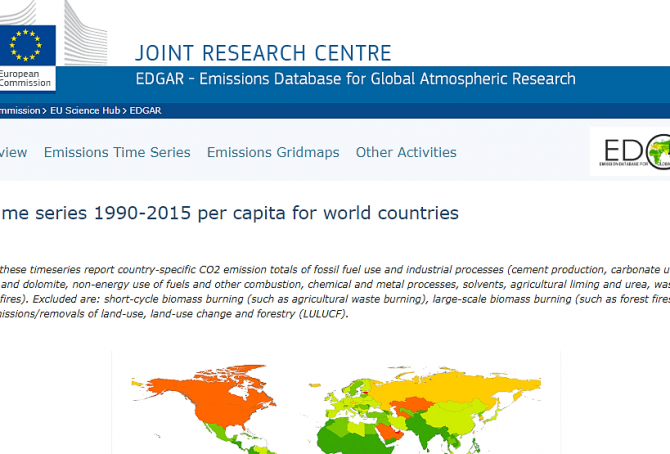
National per capita CO2 Emissions from Fossil Fuels (without bunkers) and industrial processes in 2016 have been released by ‘EDGAR‘. At the same time, recalculated historic emissions have been released, which for some countries make a considerable difference¹ (also with regard to Climate Debt in ClimatePositions). The updated calculations are available in ‘Calculation (Excel)‘, and new rankings of 163 countries are available in the menu “Climate Debt”.
The table below shows World average, and the 15 countries with the largest per capita CO2 Emissions from Fossil Fuels and industrial processes in 2016, in tons, in comparison with average emissions 1990-1999, 2000-2009 and 2010-2015.

Indicator update: Ecological Footprint 2017 (without Carbon Footprint)
2017
The updated per capita Ecological Footprint¹ for 192 is available for licensing by ‘Global Footprint Network‘ (Public Data Package – Free Download). The average Ecological Footprint without the weighty Carbon Footprint², since 2005, is used as an ‘Indicator‘ in ClimatePositions when calculating national Climate Debts. The footprint-indicator includes: 1) Built-up Land, 2) Cropland, 3) Grazing Land, 4) Forest Product and 5) Fishing Ground, all allocated to the consumption components of Food, Shelter, Mobility, Goods and Services.
The relative per capita Ecological Footprints without carbon, over time, of the ‘90 countries with Climate Debt‘ are shown in the table below. An average country among 172 countries in ClimatePositions is set at 100. Note that the data-year is about 4 years prior to the release year.
ClimatePositions has been updated with Fossil CO2 Emissions data from EDGAR
2017
As announced in the previous ‘Article‘ the calculations of Climate Debt by country in ClimatePositions has now been updated with CO2 Emissions data from ‘EDGAR‘ (European Commission), instead of data from Global Carbon Project (CDIAC).
At the same time, the global CO2 target has been raised by 0.2 tons per capita by 2025, and the indicators of Ecological Footprint (without carbon) and GDP (ppp-$) 2016 have been updated as well. New updated rankings are available in the menu “Climate Debt” above. Updated data and diagrams with all ‘Indicators‘ and all countries are available in the submenu ‘Calculations (Excel)‘.
The table below shows the new ranking of 163 countries in comparison with the previous (last) ranking (159 countries) with emission data from Global Carbon Project (CDIAC). No Climate Debt is marked “free”. Only Montenegro is excluded from the new ranking due to missing CO2 Emission data (ranks 69th in the previous ranking).

Global Carbon Project (CDIAC), located in the United States, stops publishing carbon emissions data by country – will be replaced by EDGAR in ClimatePositions
2017
The Carbon Dioxide Information Analysis Center (CDIAC), located at the U.S. Department of Energy’s (DOE) Oak Ridge National Laboratory, has published annual Carbon Emissions from Fossil Fuels and cement production by country since 1959 (‘Global Carbon Project‘), but now this continuous time series has come to an end and 2015 will be the last data-year (as it seems).
Since carbon emissions data from CDIAC (Global Carbon Project) is the core ‘Indicator‘ in ClimatePositions’ calculation of Climate Debt, carbon emissions data will be replaced with nearly similar data from ‘EDGAR‘ (‘European Commission‘ / ‘Climate Action‘), retroactively since 1990, in connection with the coming updates [done 16-08-2017].
The following describes the differences between CO2 Emissions data from Global Carbon Project (CDIAC) and EDGAR (sourced: European Commission, Joint Research Centre (JRC)/Netherlands Environmental Assessment Agency (PBL). Emission Database for Global Atmospheric Research (EDGAR)), and the consequences in terms of Climate Debt in ClimatePositions – illustrated with a range of country examples. Note that other sources, such as ‘IEA‘, ‘EIA‘ and ‘BP‘, provides CO2 Emissions data-sets different from the ones of CDIAC and EDGAR.
Indicator updates: GDP-ppp 2016 and Climate Change Financing (now only Multilateral Funds)
2017
2016-updates of national per capita GDP(ppp-$) from ‘World Bank‘ is now available in ‘Calculation (Excel)‘. The world’s average per capita GDP(ppp-$) grew from $15,668 in 2015 to 16,136 in 2016 (3.0% growth). The diagram below shows the development in per capita GDP(ppp-$) 2000-2016 of the world’s five largest per capita emitters of CO2 from Fossil Fuel and cement: Qatar, Trinidad and Tobago, Kuwait, Bahrain and Brunei; in comparison with the world average.

Indicator update: Climate change financing as share of Climate Debt, by country (Climate Funds Update)
2017
‘Climate Funds Update‘ is providing information on finance for developing countries to address climate change. Around $26 billion has currently been funded (money deposited; data from October 2016), of which 96% is country-sourced. If all sources of income are included¹, then the funds amount to $30 billion, of which 81% is country-sourced. The country-sourced climate finance has increased by 25% since June 2016 (in eight months). The previous seven month the increase was 24%.
The table below shows: 1) the current Climate Debt per capita in ClimatePositions, 2) the per capita climate change financing (funding) to developing countries and 3) the climate financing as share of the Climate Debt. The table includes 35 countries with both climate change financing and Climate Debt in ClimatePositions. Note that only countries with full data in ClimatePositions are included.
Global Indicator Update: Land Temperature 2016 (warmest year on record)
2017
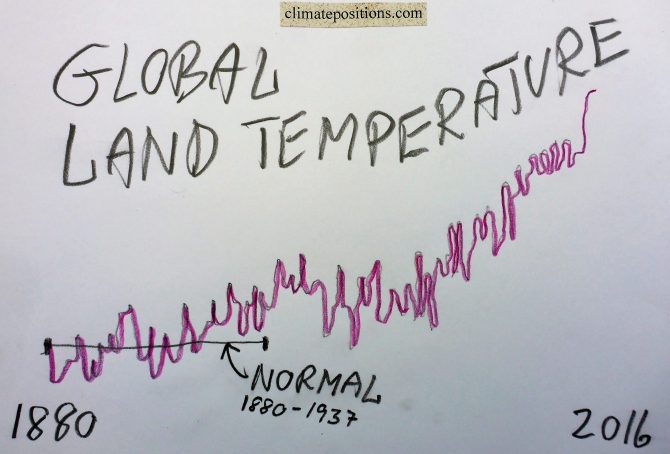
The year 2016 was by far the hottest on planet Earth since measurements began in 1880. Both global Land (air) Temperature and Ocean (air) Temperature were the hottest on record. See the development in Land Temperature between 1960 and 2016 in the diagram below. The average temperature rise 1880-1937 is set at 0°C (baseline 1880-1937) and 2016 was 1.73°C warmer. The development since 1880 in Land Temperature and Ocean Temperature (and the two combined) are available at ‘ncdc.noaa.gov‘.
Added 22-01-17: The Ocean Temperature 2016 was 0.94°C warmer compared to baseline 1880-1937, and Land and Ocean Temperature combined was 1.15°C warmer. Note that other sources may refer to baseline 1881-1910 or even 1951-1980.
Added 07-02-2017: Soon, the global temperature ‘Indicator’ in ClimatePosition will be changed from Land (air) Temperature (10-years average) to Land/Ocean (air) Temperature (10-years average). The change will not affect the current accumulated Climate Debt of any country, only the future calculation.

Global Indicator Updates 2016: Sea Level, Population and CO2 Content in the atmosphere
2017
The estimated annual global Sea Level rise since 1993 increased from 3.3 mm (±0.4 mm) in 2015 to 3.4 mm (±0.4 mm) in 2016. The increase suggests an accelerating rate of Sea Level rise, which is illustrated in the diagram below. The growing volume of the oceans is caused by two effects of global warming: melting ice and warmer oceans. In ClimatePositions the Sea Level rise between 1880 and 1993 is set at 1.2 mm annually, or 14 cm during the 113-year period. The total estimated Sea Level rise between 1880 and 2016 adds up to 21.82 cm and this figure is used as an ‘Indicator‘ in ClimatePositions.
The Sea Level rise between 2004 and 2016 is shown below (Sea Level 1880 and 1993 is set at 0 cm and 14 cm, respectively) – the unscientific polynomial trend line projects the scary tendency by 2100.

Final Update 2015: new rankings of 159 countries’ Climate Debt, accumulated since 2000
2016
Every five year, since 2005, Final Updates of national Climate Debts are completed in ClimatePositions and 2015-updates¹ are now available in ‘Calculation (Excel)‘. New rankings in six categories, of 159 countries, are available in the menu “Climate Debt”. In the coming months, the climate change performances of selected countries will be analyzed in articles, starting with the United States and China.
The following illustrate Final Update 2015 in two ways: 1) The change of Climate Debt as percentage of the global Climate Debt, annually since 2000, of the 10 largest CO2 emitters, and 2) Key-figures of the United States.
The table below of the 10 largest CO2 emitters (representing 70% of the global emissions in 2015) shows the national shares of the global Climate Debt in 2015 and 2010. China, Russia and Saudi Arabia stand out with extremely harmful developments, while the United States still has by far the largest Climate Debt. See the latest ‘Ranking’ of 159 countries.

Indicator update: Per capita CO2 Emissions 2015, by country (preliminary)
2016
‘Carbon Dioxide Information Analysis Center (CDIAC)‘, or simply Global Carbon Project, has published preliminary¹ national carbon emissions, from Fossil Fuels and cement, in 2015. The total national carbon emissions are converted to per capita carbon dioxide emissions (tons of CO2 Emissions) by multiplying by 3.664 and then divide by Population (sourced ‘World Bank‘).
The table below shows the per capita CO2 Emissions from Fossil Fuels (without bunkers) and cement, in tons, in 2012, 2013, 2014 and 2015 of all 97 countries with Climate Debt in ClimatePositions, after the key indicator update (see the ‘Ranking‘). Updates of 199 countries are available in the menu ‘Calculation (Excel)‘. Note that emissions in 2014 and 2015 are preliminary estimates.

Indicator update: Ecological Footprint (Climate Debt of 15 additional small countries)
2016
The per capita Ecological Footprint¹ for 186 countries has been released for licensing by ‘Global Footprint Network’ (Public Data Package – Free Download). The total national Footprint without the weighty carbon Footprint² is used as an ‘Indicator’ in ClimatePositions. Now 15 additional small countries have full data and thus calculation of Climate Debt for the first time. The per capita Climate Debt of these countries are listed below. Brunei, Luxembourg and Equatorial Guinea enter top-ten of the worst performing countries among the previous 148 countries (see the ‘Ranking’ by January 2016).
Update: GDP(ppp-$) 2015
2016
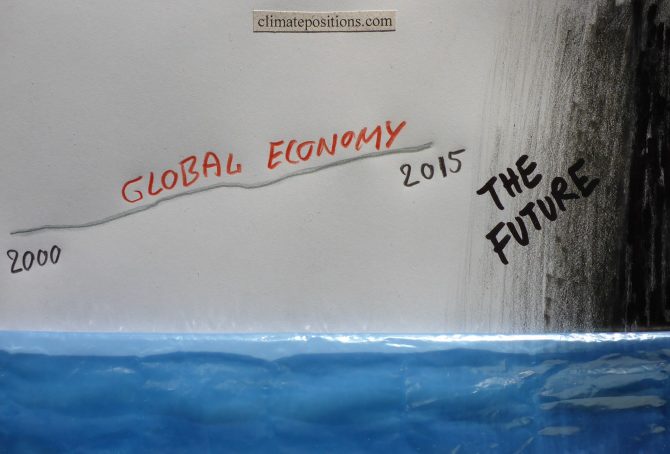
2015-updates of national per capita GDP(ppp-$) from ‘World Bank’ is now available in ‘Calculation (Excel)’. The world’s average per capita GDP(ppp-$) grew from $15,065 in 2014 to $15,470 in 2015 (2.7% growth). In the midst of an unprecedented man-made climate catastrophe and the ‘Sixth mass extinction’ in progress, the human economy keeps growing.
The diagram below shows the development in per capita GDP(ppp-$) 2000-2015 of the world’s five largest emitters of CO2 from Fossil Fuel and cement: China (27.0% of the global emissions), the United States (14.7%), India (7.2%), Russia (4.9%) and Japan (3.4%), in comparison with the world’s average.

Forest Cover and Primary Forests 1990-2015 (two country groups are examined)
This article is sourced from two publications by ‘FAO’: ‘Forest Ecology and Management 2015 (pdf 145 p)’ and ’Global Forest Resources Assessment 2015 (pdf 253 p)’. The latter contains 46 different tables¹ with 234 countries and territories forest development 1990-2015.
Primary Forest is defined as naturally regenerated forest of native species, where there are no clearly visible indications of human activities and the ecological processes are not significantly disturbed. Today, Primary forest accounts for 32% of global Forest Cover and has apparently increased by around 6.8% between 1990 and 2015, however, this increase is largely due to the fact that more countries have submitted data for the statistic. This taken into account, an overall global Primary Forest loss of 2.5%, since 1990, is more likely (and 10.0% loss in the tropics).