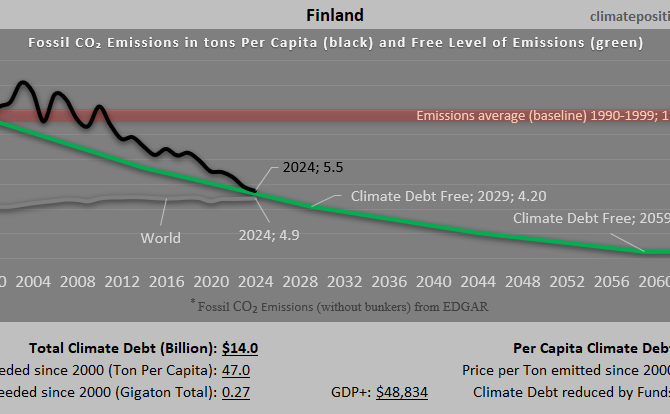
Climate Debt of Finland 2025: $14.0 Billion or 0.15% of the Global Climate Debt (or $2475 Per Capita)
/2025/ Finland ranks 25th in Climate Debt Per Capita accumulated 2000-2025. Below are some key figures in the calculations. The diagram above shows the Fossil CO2 Emissions Per Capita and the Free Level of emissions (green). The wide straight red line shows emissions in the 1990s (baseline in the calculations).
Finland: Per Capita Climate Debt $2,504 (Ranked 25) – Fossil CO2 Emissions
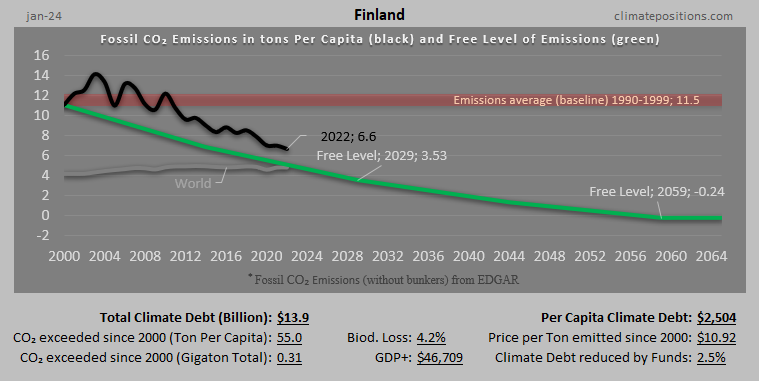
In 2024, Finland is responsible for 0.18% of the Global Climate Debt accumulated since 2000. Below are some key figures in the calculations.
Canada – per capita Fossil CO2 Emissions and Climate Debt
2020
Canada’s current Climate Breakdown Pricing amounts to $29.84 per tons Fossil CO2 emitted since 2000. The Climate Debt grew from $6,452 per capita in 2015 to $9,685 in 2020. Updated Rankings of 165 countries are available in the menu “Climate Debt”.
The following diagrams expose the trends of Fossil CO2 Emissions, Climate Debt, GDP(ppp-$), Nuclear Power and Ecological Footprint without carbon.
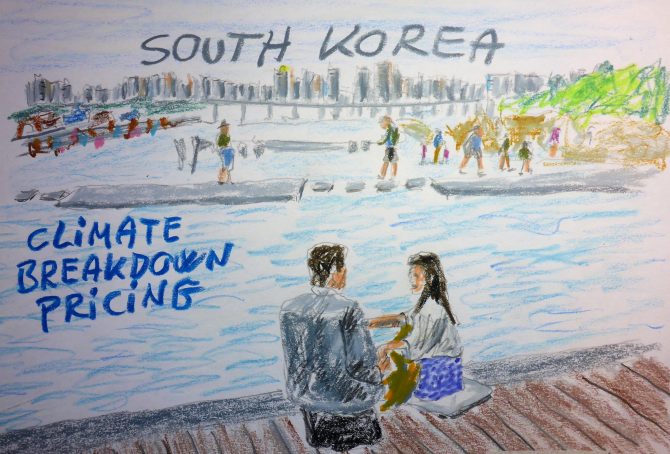
South Korea – per capita Fossil CO2 Emissions and Climate Debt
2020
South Korea’s current Climate Breakdown Pricing amounts to $33.53 per tons Fossil CO2 emitted since 2000. The Climate Debt grew from $3,608 per capita in 2015 to $7,397 in 2020. Updated Rankings of 165 countries are available in the menu “Climate Debt”.
The following diagrams expose the trends of Fossil CO2 Emissions, Climate Debt, GDP(ppp-$) and Ecological Footprint without carbon.

Russia – per capita Fossil CO2 Emissions and Climate Debt
2020
Russia’s current Climate Breakdown Pricing amounts to $12.16 per tons Fossil CO2 emitted since 2000. The Climate Debt grew from $1,346 per capita in 2015 to $2,676 in 2020. Updated Rankings of 165 countries are available in the menu “Climate Debt”.
The following diagrams expose the trends of Fossil CO2 Emissions, Climate Debt, GDP(ppp-$) and Ecological Footprint without carbon.
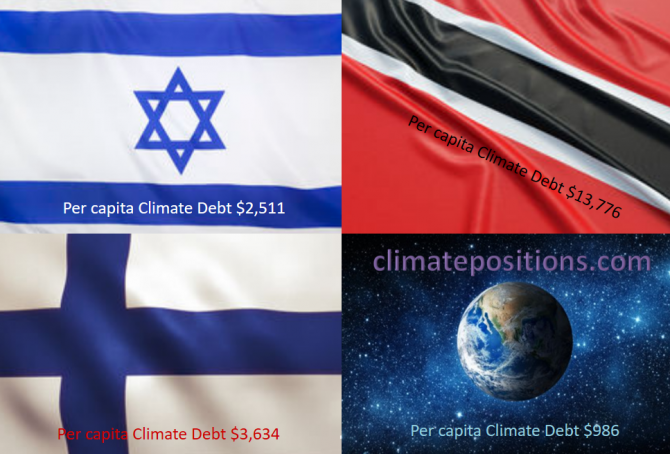
Share of global Climate Debt rank 34th, 35th and 36th: Israel, Finland and Trinidad and Tobago (combined responsible for 0.83% of Climate Debt and 0.42% of Fossil CO2 Emissions 2016)
2017
The diagram below shows ‘Share of global Climate Debt‘ in 2010, 2015 and 2017 of Israel, Finland and Trinidad and Tobago (ranked 34th, 35th and 36th). The shares of Israel and Finland have decreased continuously, whereas the one of Trinidad and Tobago is nearly stable.
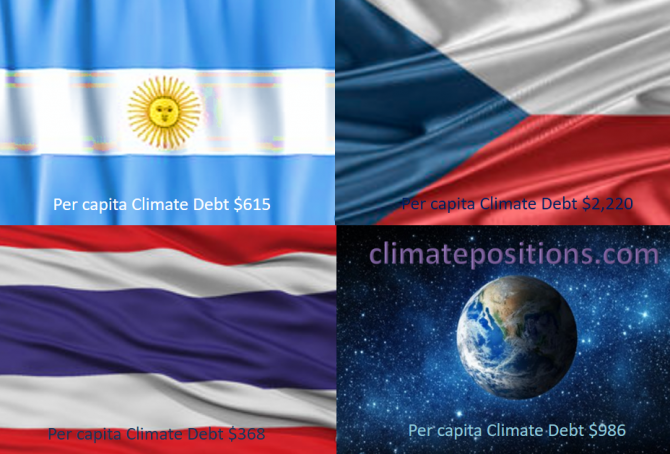
Share of global Climate Debt rank 31st, 32nd and 33rd: Argentina, Thailand and Czech Republic (combined responsible for 1.0% of Climate Debt and 1.6% of Fossil CO2 Emissions 2016)
2017
The diagram below shows ‘Share of global Climate Debt‘ in 2010, 2015 and 2017 of Argentina, Thailand and Czech Republic (ranked 31st, 32nd and 33rd). The share of Argentina is increasing while the share of Thailand has flattened out.

Climate Debt: Finland ranks 13th among 148 countries
Finland’s current Climate Debt is $3,078 per capita and the ‘Ranking’ by January 2016 was 13th among 148 countries, compared to 10th ranked in 2010. The following examines the Finnish CO2 Emissions, Nuclear Power, Forest Cover, Environmental Performance and GDP(ppp-$), in comparison with the four largest trade partners Russia, Germany, Sweden and United Kingdom.

Climate Debt: Norway ranks 9th (performance of top twenty from Human Development Index)
The so called ‘Human Development Index 2015’ (UN) ranks Norway 1st among 188 countries. The index is based on 1) Life expectancy at birth, 2) Expected years of schooling, 3) Mean years of schooling and 4) Gross national income (GNI) per capita. However, the wealthy Scandinavian oil state ‘Ranks‘ 9th among 148 countries on Climate Debt per capita. Norway is in other words a highly human developed demolisher of the climate, one might say! The following examines the climate performance of Norway in comparison with the other top five countries from Human Development Index: Australia, Switzerland, Denmark and Netherland.
Canada now ranks 10th in Climate Debt per capita (due to black transition)
Canada covers 7.3% of planet’s land area and populates 0.5% of its people. The Climate Debt of the 35 million Canadians amounts to $183 billion, or $5,138 per capita, which ‘Ranks’ Canada 10th among 148 countries. In 2010 the ranking was 7th. The following compares the Canadian performance with the ones of Australia, New Zealand, Sweden and Finland – all wealthy developed countries with small or relatively small population density¹.
Sweden beats Finland in climate change performance
2015
Finland’s updated Climate Debt is $2,624 per capita and Sweden’s is $1,003. The ‘2014-rankings’ were 18th and 37th among 147 countries. The following examines the indicators of CO2 Emissions from fossil fuels, Nuclear Power, GDP(ppp-$), Climate Debt as a percentage of GDP(ppp-$) and Forest Cover.
Income Equality, Life Expectancy, Democracy Index … and Climate Contributions
2014
123 out of 145 countries with full data in ClimatePositions are included in an inventory of Income Equality (see the source at the bottom), which shows how much the 10% poorest earns compared to the 10% richest. 53 out of the 123 countries are Contribution Free (no climate debt) in ClimatePositions 2010 and 70 countries are not.
The table below shows the difference between the two groups of countries in terms of Income Equality, Life Expectancy, number of Full Democracies and number of Authoritarian Regimes. To clarify the trend the 20 countries with the largest Climate Contributions appear at the top of the table. The 123 countries represent 95% of the world population.

Putin’s Russia is deteriorating ecologically
2013
Russia was the world’s third largest CO2 Emitter (carbon dioxide) in 2006-2010 and the authoritarian regime was the 31st worst performing country in ClimatePositions 2010. In 2005 the ranking was 34th and in 2000 43rd. The negative development under Putin is unquestionable.