Turkmenistan – per capita Fossil CO2 Emissions and Climate Debt
2020
Turkmenistan’s current Climate Breakdown Pricing amounts to $12.37 per tons Fossil CO2 emitted since 2000. The Climate Debt grew from $1,300 per capita in 2015 to $2,799 in 2020. Updated Rankings of 165 countries are available in the menu “Climate Debt”.
The following diagrams expose the trends of Fossil CO2 Emissions, Climate Debt, GDP(ppp-$) and Ecological Footprint without carbon.
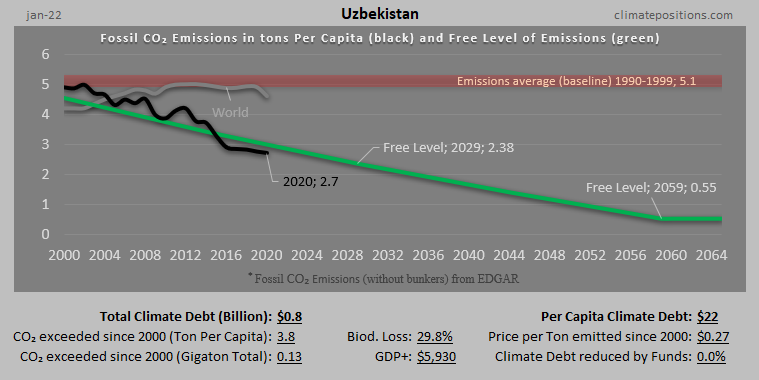
Uzbekistan – per capita Fossil CO2 Emissions and Climate Debt
2020
Uzbekistan’s current Climate Breakdown Pricing amounts to $1.20 per tons Fossil CO2 emitted since 2000. The Climate Debt grew from $43 per capita in 2015 to $93 in 2020. Updated Rankings of 165 countries are available in the menu “Climate Debt”.
The following diagrams expose the trends of Fossil CO2 Emissions, Climate Debt, GDP(ppp-$) and Environmental Performance.
Pakistan – per capita Fossil CO2 Emissions (zero Climate Debt)
2020
Although Pakistan’s accumulated Climate Debt is zero, the populous country is the world’s 32nd largest emitter of Fossil CO2.
The following diagrams expose the trends of Fossil CO2 Emissions, GDP(ppp-$), Environmental Performance and Ecological Footprint without carbon.
Kazakhstan – per capita Fossil CO2 Emissions and Climate Debt
2020
Kazakhstan’s current Climate Breakdown Pricing amounts to $16.18 per tons Fossil CO2 emitted since 2000. The Climate Debt grew from $2,041 per capita in 2015 to $4,025 in 2020. Updated Rankings of 165 countries are available in the menu “Climate Debt”.
The following diagrams expose the trends of Fossil CO2 Emissions, Climate Debt, GDP(ppp-$) and Ecological Footprint without carbon.
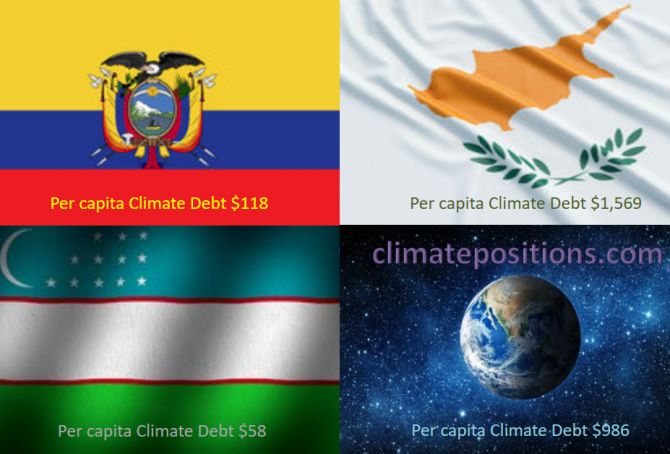
Share of global Climate Debt rank 67th, 68th and 69th: Ecuador, Uzbekistan and Cyprus (combined responsible for 0.08% of Climate Debt and 0.44% of Fossil CO2 Emissions 2016)
2018
The diagram below shows ‘Share of global Climate Debt‘ in 2010, 2015 and 2017 of Ecuador, Uzbekistan and Cyprus (ranked 67th, 68th and 69th). The share of Cyprus is continuously decreasing.
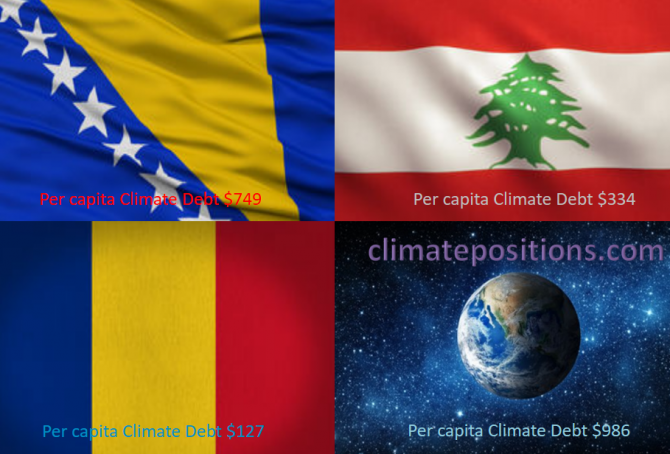
Share of global Climate Debt rank 64th, 65th and 66th: Bosnia and Herzegovina, Romania and Lebanon (combined responsible for 0.10% of Climate Debt and 0.35% of Fossil CO2 Emissions 2016)
2018
The diagram below shows ‘Share of global Climate Debt‘ in 2010, 2015 and 2017 of Bosnia and Herzegovina, Romania and Lebanon (ranked 64th, 65th and 66th). The shares of Romania and Lebanon are ups and downs, while the share of Bosnia and Herzegovina is steadier.
China’s share of the global Climate Debt is growing fast
In 2010 China’s share of the global Climate Debt was 7.4% and by January 2016 it has grown dramatically to 13.3% (see the ‘ranking’). Since 2000 the Chinese share of the growing global CO2 Emissions has grown from 13.7% to about 29.0% (preliminary emissions by 2014). Luckily, the populous superpower has committed itself to pursue “efforts to limit the temperature increase to 1.5 °C” … according to the COP21 Paris Agreement. The following examines the development of CO2 Emissions, Environmental Performance, GDP(ppp-$), Climate Debt and Population (with respect to the one-child policy).
Climate change performance of Turkmenistan, Uzbekistan, Kyrgyzstan and Tajikistan
2015
0.7% of the global population lives in Turkmenistan, Uzbekistan, Kyrgyzstan or Tajikistan, and together they emitted 0.6% of the global CO2 from fossil fuels in 2012. Turkmenistan’s updated Climate Debt per capita is $1,394 and Uzbekistan’s is $84. Kyrgyzstan and Tajikistan are both Contribution Free (no Climate Debt). See the ‘ranking’ of 147 countries by November 2014. The following examines the CO2 Emissions (carbon dioxide from fossil fuels), GDP(ppp-$) and Climate Debt as a percentage of GDP.
Climate change performance of Turkmenistan, Kazakhstan and Uzbekistan
2014
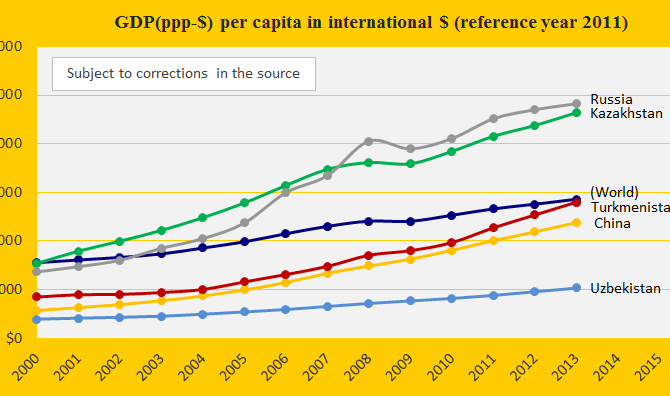
The three authoritarian regimes Turkmenistan, Kazakhstan and Uzbekistan were ranked respectively 31st, 40th and 71st on the worst performing list in ClimatePositions 2010. Their updated Climate Contributions (climate debt) are $1,043, $797 and $60 per capita. See the ranking ‘here’. The first diagram shows the GDP(ppp-$) per capita of the three neighboring countries located in the region Eurasia where the Middle East, Asia and Europe meet, in comparison with China, Russia and the world average.
