
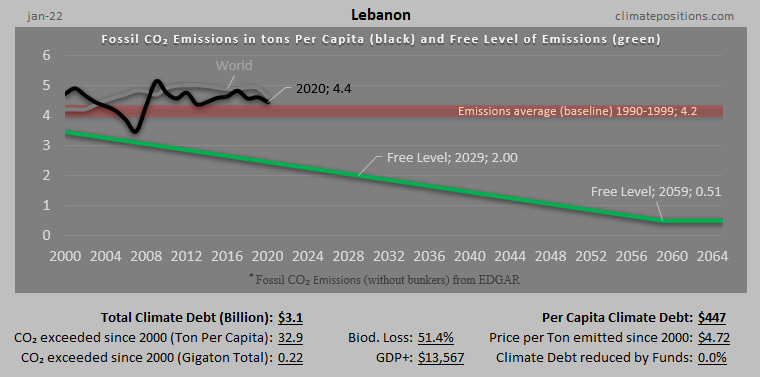
Climate Debt of Lebanon 2025: $1.6 Billion or 0.02% of the Global Climate Debt (or $274 Per Capita)
/2025/ Lebanon ranks 71st in Climate Debt Per Capita accumulated 2000-2025. Below are some key figures in the calculations. The diagram above shows the Fossil CO2 Emissions Per Capita and the Free Level of emissions (green). The wide straight red line shows emissions in the 1990s (baseline in the calculations).

Iraq – per capita Fossil CO2 Emissions and Climate Debt
2020
Iraq’s current Climate Breakdown Pricing amounts to $4.04 per tons Fossil CO2 emitted since 2000. The Climate Debt grew from $66 per capita in 2015 to $303 in 2020. Updated Rankings of 165 countries are available in the menu “Climate Debt”.
The following diagrams expose the trends of Fossil CO2 Emissions, Climate Debt, GDP(ppp-$) and Ecological Footprint without carbon.

Egypt – per capita Fossil CO2 Emissions and Climate Debt
2020
Egypt’s current Climate Breakdown Pricing amounts to $3.58 per tons Fossil CO2 emitted since 2000. The Climate Debt grew from $79 per capita in 2015 to $161 in 2020. Updated Rankings of 165 countries are available in the menu “Climate Debt”.
The following diagrams expose the trends of Fossil CO2 Emissions, Climate Debt and GDP(ppp-$).
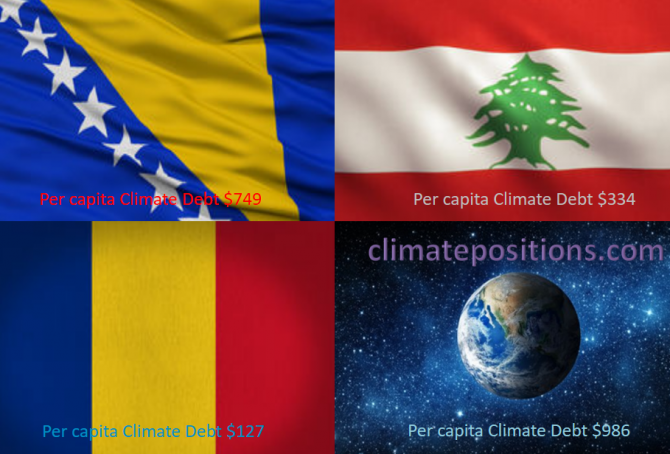
Share of global Climate Debt rank 64th, 65th and 66th: Bosnia and Herzegovina, Romania and Lebanon (combined responsible for 0.10% of Climate Debt and 0.35% of Fossil CO2 Emissions 2016)
2018
The diagram below shows ‘Share of global Climate Debt‘ in 2010, 2015 and 2017 of Bosnia and Herzegovina, Romania and Lebanon (ranked 64th, 65th and 66th). The shares of Romania and Lebanon are ups and downs, while the share of Bosnia and Herzegovina is steadier.
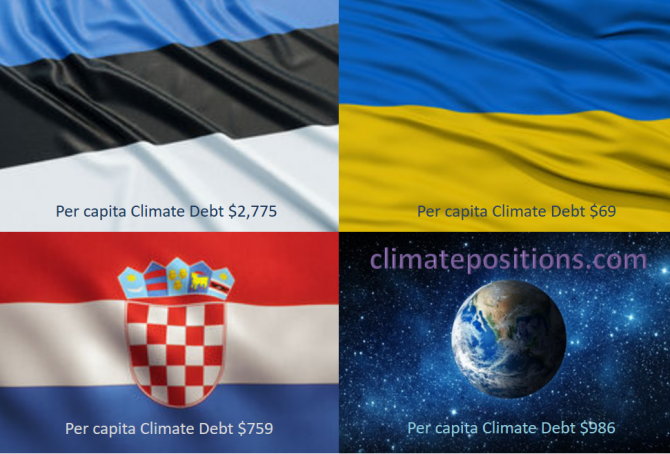
Share of global Climate Debt rank 61st, 62nd and 63rd: Estonia, Croatia and Ukraine (combined responsible for 0.14% of Climate Debt and 0.77% of Fossil CO2 Emissions 2016)
2018
The diagram below shows ‘Share of global Climate Debt‘ in 2010, 2015 and 2017 of Estonia, Croatia and Ukraine (ranked 61st, 62nd and 63rd). The shares of Estonia and Ukraine are increasing, whereas the share of Croatia is decreasing.

Climate change performance of Israel, Lebanon and Jordan (refugees from the Syrian Civile War)
2015
The ‘Syrian Civil War’ and other violent conflicts in the region are causing huge numbers of refugees. According to ‘The UN Refugee Agency (UNHCR)’ around 1.2 million refugees lived in Lebanon by December 2014, which was 28% of the usual population. In Jordan, the percentage of refugees was 10% and in Israel 0.5%. For comparison, the world average is about 0.8% (60 million refugees globally). Under these tragic circumstances carbon dioxide emissions and Climate Debt is of cause inconsiderate to discuss, but on the other hand, manmade climate destruction also causes mass refugees, mutilation and death … with increasing force in the coming decades. Experts foresee about 200 million climate refugees by 2050, or about 2% of the projected global population of 10 billion. Or roughly speaking: Two-thirds more refugees, due to climate change alone, in a world with one-third more people – in 35 years.

Climate performance of Israel, Occupied Palestinian Territories and neighboring countries
2014
Israel was the 16th worst performing country out of 145 in ClimatePositions 2010 with a Climate Contribution of $1,790 per capita (see the ranking in the menu “Calculation”). The Palestinian Territories (Gaza Strip and West Bank, both occupied by Israel) were in reality Contribution Free (though excluded from the inventory due to lack of indicator data¹). The following examines the statistics of Israel, the Occupied Palestinian Territories, Lebanon, Jordan, Syria and Egypt.