
Climate Debt of France 2025: $50 Billion or 0.54% of the Global Climate Debt (or $731 Per Capita)
/2025/ France ranks 56th in Climate Debt Per Capita accumulated 2000-2025. Below are some key figures in the calculations. The diagram above shows the Fossil CO2 Emissions Per Capita and the Free Level of emissions (green). The wide straight red line shows emissions in the 1990s (baseline in the calculations).
France: Per Capita Climate Debt $1,707 (Ranked 36) – Fossil CO2 Emissions

In 2024, France is responsible for 1.48% of the Global Climate Debt accumulated since 2000. Below are some key figures in the calculations.

Belgium – per capita Fossil CO2 Emissions and Climate Debt
2020
Belgium’s current Climate Breakdown Pricing amounts to $22.93 per tons Fossil CO2 emitted since 2000. The Climate Debt grew from $2,025 per capita in 2015 to $4,490 in 2020. Updated Rankings of 165 countries are available in the menu “Climate Debt”.
The following diagrams expose the trends of Fossil CO2 Emissions, Climate Debt, GDP(ppp-$), Nuclear Power and Ecological Footprint without carbon.

Spain – per capita Fossil CO2 Emissions and Climate Debt
2020
Spain’s current Climate Breakdown Pricing amounts to $16.05 per tons Fossil CO2 emitted since 2000. The Climate Debt grew from $1,173 per capita in 2015 to $2,110 in 2020. Updated Rankings of 165 countries are available in the menu “Climate Debt”.
The following diagrams expose the trends of Fossil CO2 Emissions, Climate Debt, GDP(ppp-$) and Ecological Footprint without carbon.

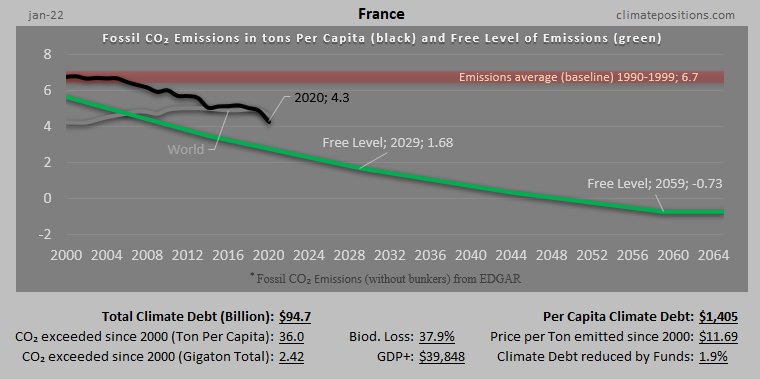
France – per capita Fossil CO2 Emissions and Climate Debt
2020
The current Climate Breakdown Pricing of France amounts to $16.87 per tons Fossil CO2 emitted since 2000. The Climate Debt grew from $953 per capita in 2015 to $1,876 in 2020. Updated Rankings of 165 countries are available in the menu “Climate Debt”.
The following diagrams expose the trends of Fossil CO2 Emissions, Climate Debt, GDP(ppp-$), Nuclear Power and Ecological Footprint without carbon.

Italy – per capita Fossil CO2 Emissions and Climate Debt
2020
Italy’s current Climate Breakdown Pricing amounts to $13.47 per tons Fossil CO2 emitted since 2000. The Climate Debt grew from $1,003 per capita in 2015 to $1,841 in 2020. Updated Rankings of 165 countries are available in the menu “Climate Debt”.
The following diagrams expose the trends of Fossil CO2 Emissions, Climate Debt, GDP(ppp-$) and Ecological Footprint without carbon.

United Kingdom – per capita Fossil CO2 Emissions and Climate Debt
2020
The current Climate Breakdown Pricing of the United Kingdom amounts to $11.17 per tons Fossil CO2 emitted since 2000. The Climate Debt grew from $871 per capita in 2015 to $1,614 in 2020. Updated Rankings of 165 countries are available in the menu “Climate Debt”.
The following diagrams expose the trends of Fossil CO2 Emissions, Climate Debt, GDP(ppp-$), Nuclear Power and Ecological Footprint without carbon.

Germany – per capita Fossil CO2 Emissions and Climate Debt
2020
Germany’s current Climate Breakdown Pricing amounts to $18.68 per tons Fossil CO2 emitted since 2000. The Climate Debt grew from $1,562 per capita in 2015 to $3,536 in 2020. Updated Rankings of 165 countries are available in the menu “Climate Debt”.
The following diagrams expose the trends of Fossil CO2 Emissions, Climate Debt, GDP(ppp-$), Nuclear Power and Ecological Footprint without carbon.
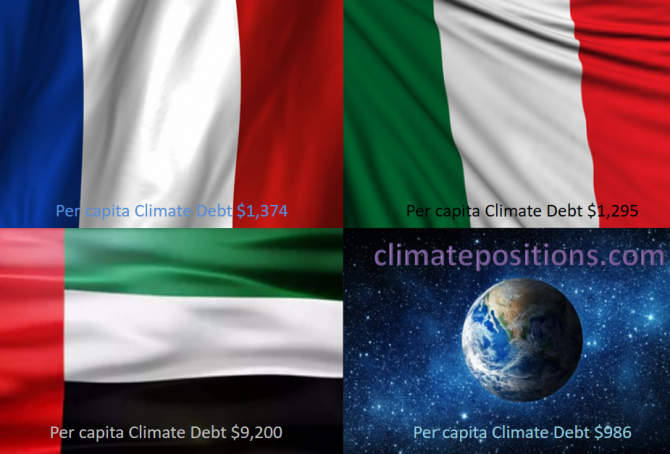
Share of global Climate Debt rank 13th, 14th and 15th: France, United Arab Emirates and Italy (combined responsible for 3.5% of Climate Debt and 2.5% of Fossil CO2 Emissions 2016)
2017
The diagram below shows ‘Share of global Climate Debt‘ in 2010, 2015 and 2017 of France, United Arab Emirates and Italy (ranked 13th, 14th and 15th). The share of United Arab Emirates has increased along with an extreme population growth.
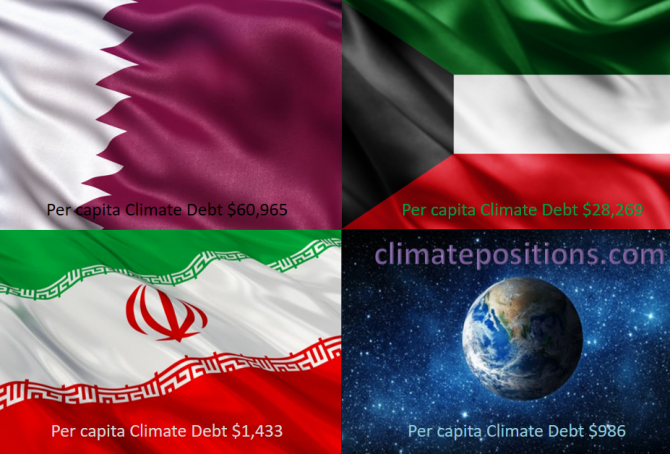
Share of global Climate Debt rank 10th, 11th and 12th: Qatar, Iran and Kuwait (combined responsible for 5.4% of Climate Debt and 2.4% of Fossil CO2 Emissions 2016)
2017
The diagram below shows ‘Share of global Climate Debt‘ in 2010, 2015 and 2017 of Qatar, Iran and Kuwait (ranked 10th, 11th and 12th). The share of Qatar has increased fast along with the extreme population growth. All three countries seem to have peaked on global shares around 2015.
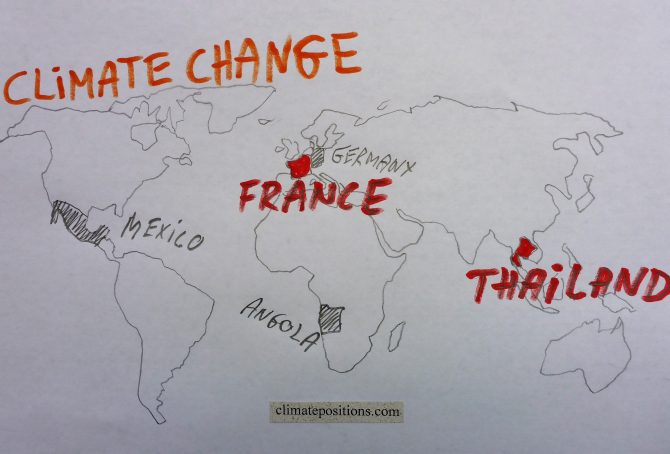
Climate change performance: Thailand vs. France
2017
Thailand and France are the world’s 19th and 20th largest emitters of CO2 from Fossil Fuels and cement. Combined, the two countries were responsible for 1.8% of world CO2 Emissions in 2015. The following examines the ‘Indicators‘ of CO2 Emissions, GDP(ppp-$), Ecological Footprint, Forest Cover and Nuclear Power.
The diagrams below show the per capita CO2 Emissions from Fossil Fuel (without bunkers) and cement, since 2000. The green bars show the Free Emission Level¹ – the exceedance is the basis for calculating the national Climate Debt.
Climate Debt: France ranks 35th among 148 countries
2016
France is responsible for 1.3% of the global Climate Debt of $5.7 trillion, accumulated since 2000. The French per capita Climate Debt by January 2016 was $1,148 which ‘Ranked’ France 35th among 148 countries, compared to 28th in 2010. Different rankings are available in the menu “Climate Debt”. The following examines the CO2 Emissions, Nuclear Power, Environmental Performance, GDP(ppp-$) and Climate Debt of France, in comparison with four countries with significant French-speaking populations: Canada, Belgium, Switzerland and Algeria.
The first diagram shows the French per capita CO2 Emissions from fossil fuels (without bunker fuels) and cement production in decades in comparison with the world average. CO2 Emissions since 2012 are preliminary estimates. From 6.2 tons in the 1990s the level decreased to 5.7 tons on average between 2000 and 2014 (preliminary). The green bars are the Contribution Free Level in ClimatePositions, determined by the level of emissions in the 1990s and a number of continuously updated ‘Indicators’.

Climate Debt: Norway ranks 9th (performance of top twenty from Human Development Index)
The so called ‘Human Development Index 2015’ (UN) ranks Norway 1st among 188 countries. The index is based on 1) Life expectancy at birth, 2) Expected years of schooling, 3) Mean years of schooling and 4) Gross national income (GNI) per capita. However, the wealthy Scandinavian oil state ‘Ranks‘ 9th among 148 countries on Climate Debt per capita. Norway is in other words a highly human developed demolisher of the climate, one might say! The following examines the climate performance of Norway in comparison with the other top five countries from Human Development Index: Australia, Switzerland, Denmark and Netherland.

Preliminary Carbon Dioxide Emissions 2014, by country
2015
’The Global Carbon Project’ at Carbon Dioxide Information Analysis Center (CDIAC) has published preliminary CO2 Emissions from fossil fuels and cement for 2014, for more than 200 countries. The data is being used in a preliminary calculation of accumulated Climate Debt in ClimatePositions¹. The table below shows the estimated per capita emissions plus the updated Climate Debts, of the twenty largest total emitters (responsible for 77% of the global emissions in 2014).
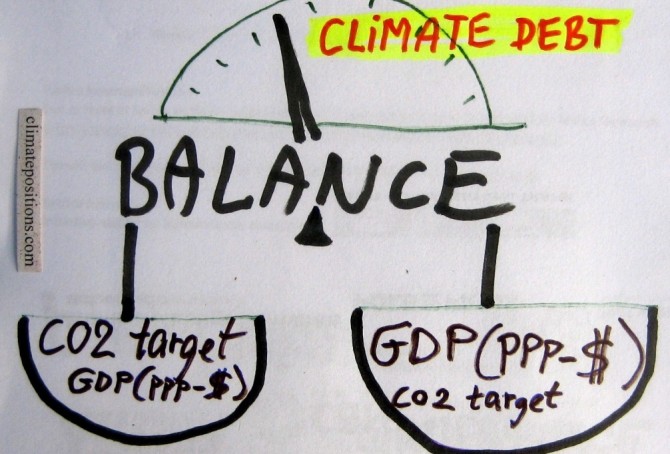
Analyses of the global CO2 target and GDP(ppp-$)
2015
The calculation of Climate Debt in ClimatePositions is based on a balance between many ‘indicators’ and a common global per capita CO2 target. To illustrate the nature of this balance twelve countries are analyzed in this article in terms of the indicator of GDP(ppp-$) and the global CO2 target. The 12-Countries Group represents 38% of the global population, 65% of the global CO2 Emissions from fossil fuels and around 70% of the global Climate Debt.
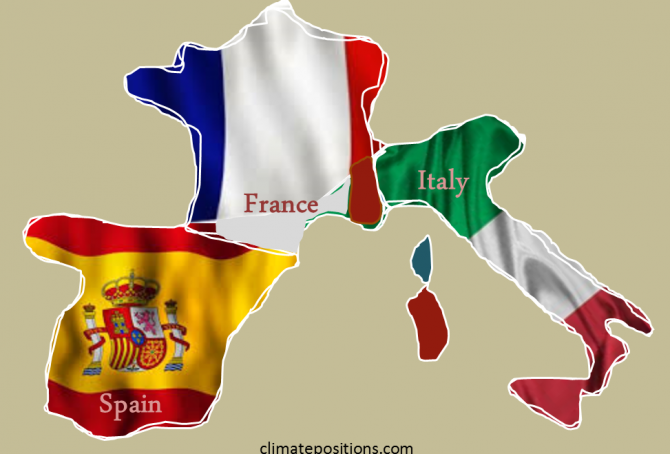
Climate change performance of Spain, France and Italy
2015
2.5% of the global population live in Spain, France or Italy and together they emitted 3.3% of the global CO2 from fossil fuels in 2012 – the combined share of the global Climate Debt is 4.3%. Spain’s updated Climate Debt per capita is $1,692 (ranked 25th), France’s is $1,352 (ranked 31st) and Italy’s is $1,034 (ranked 35th). See the ‘ranking’. The following examines the Climate Debt trends and the indicators of CO2 Emissions (carbon dioxide from fossil fuels), GDP(ppp-$), Forests, Marine Protection and Nuclear Power.

The United Kingdom beats Germany in climate change performance
2014
Germany is ranked 24th and United Kingdom 33rd among 147 countries on the list of the worst performing countries in ClimatePositions. See the ‘ranking’. The German Climate Contribution (debt) accumulated since 2000 has increased from $980 per capita in 2010 to $1,640 in the latest calculation, while the one of the United Kingdom has increased from $796 to $1,156. The first diagram shows the relative climate debt of the two countries in comparison with France, Italy and Poland, with the world average set at 100. Since 2010, the United Kingdom is the only country among the five that has improved significantly. The world average climate debt has increased from $455 per capita in 2010 to $769 in the latest calculation (this increase reflects both the growing CO2 Emissions from fossil fuels and the growing economy). The following analyses some trends for Germany and the United Kingdom.

Nuclear Power updates 2013
2014
The world’s Nuclear Power generation increased marginally in 2013 compared to 2012. The last four years of generated global nuclear electricity was:
- 2010: 2,629 billion kWh
- 2011: 2,516 billion kWh
- 2012: 2,346 billion kWh
- 2013: 2,359 billion kWh
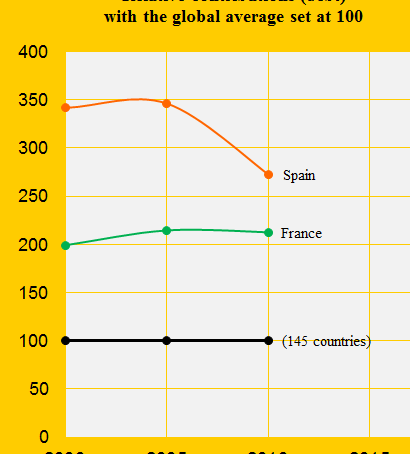
Climate performance: France versus Spain
2013
France was the 26th and Spain the 23rd worst performing country out of 145 in ClimatePositions 2010. As illustrated in the above diagram, the difference in the Contributions (climate debt) has narrowed between 2005 and 2010. Both countries have improved three rankings since 2005. See the full country list in the menu “Contributions/Per Capita US$ Rank”. The following examines the CO2 Emissions, forest area, GDP(ppp-$) and the world’s shares (Population, CO2 Emissions, GDP and Climate Contributions) of the two countries.