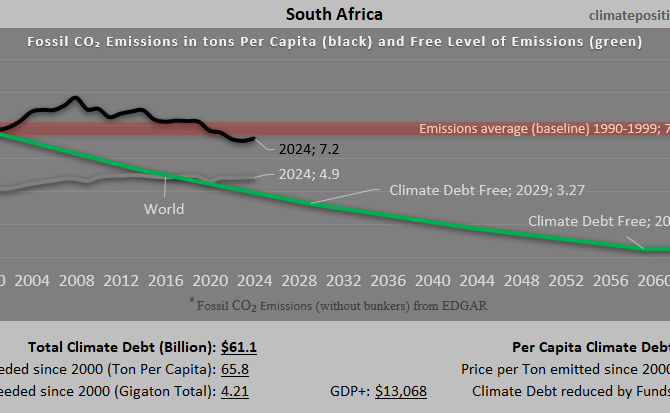
Climate Debt of South Africa 2025: $61 Billion or 0.66% of the Global Climate Debt (or $955 Per Capita)
/2025/ South Africa ranks 50th in Climate Debt Per Capita accumulated 2000-2025. Below are some key figures in the calculations. The diagram above shows the Fossil CO2 Emissions Per Capita and the Free Level of emissions (green). The wide straight red line shows emissions in the 1990s (baseline in the calculations).
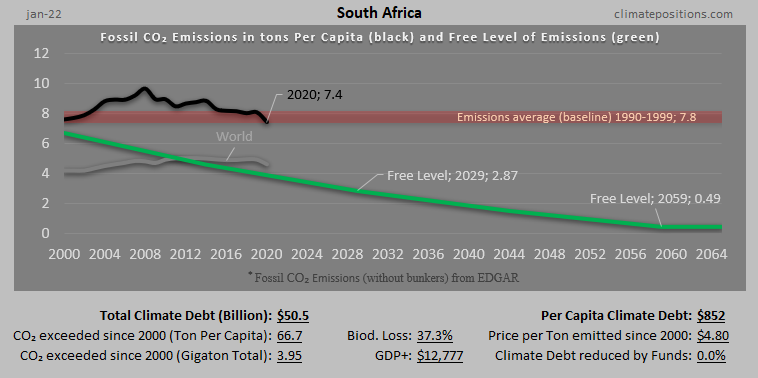
South Africa – per capita Fossil CO2 Emissions and Climate Debt
2020
South Africa’s current Climate Breakdown Pricing amounts to $8.30 per tons Fossil CO2 emitted since 2000. The Climate Debt grew from $593 per capita in 2015 to $1,355 in 2020. Updated Rankings of 165 countries are available in the menu “Climate Debt”.
The following diagrams expose the trends of Fossil CO2 Emissions, Climate Debt, GDP(ppp-$) and Ecological Footprint without carbon.
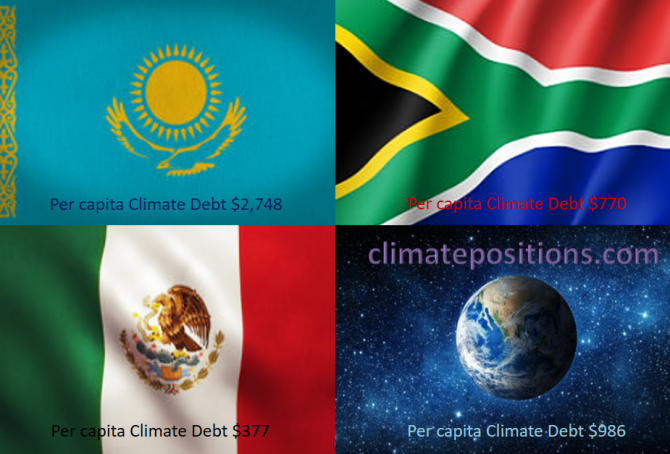
Share of global Climate Debt rank 22nd, 23rd and 24th: Kazakhstan, Mexico and South Africa (combined responsible for 1.9% of Climate Debt and 3.0% of Fossil CO2 Emissions 2016)
2017
The diagram below shows ‘Share of global Climate Debt‘ in 2010, 2015 and 2017 of Kazakhstan, Mexico and South Africa (ranked 22nd, 23rd and 24th). Kazakhstan’s share increased dramatically in a short period of time due to growing Fossil CO2 Emissions.
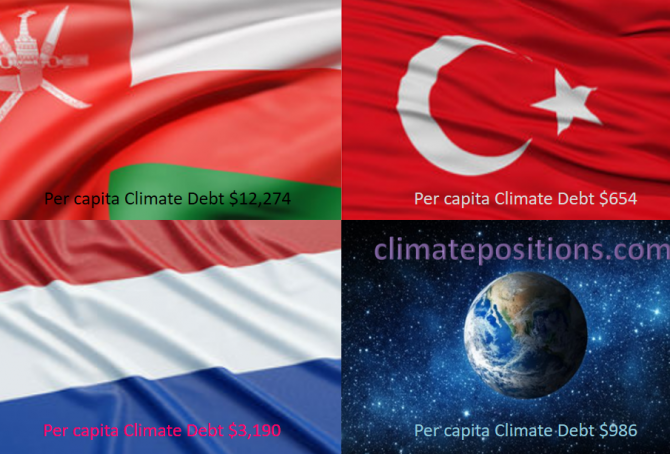
Share of global Climate Debt rank 19th, 20th and 21st: Oman, Netherlands and Turkey (combined responsible for 2.2% of Climate Debt and 1.7% of Fossil CO2 Emissions 2016)
2017
The diagram below shows ‘Share of global Climate Debt‘ in 2010, 2015 and 2017 of Oman, Netherlands and Turkey (ranked 19th, 20th and 21st). The share Netherlands is decreasing steadily, whereas Turkey’s is increasing.
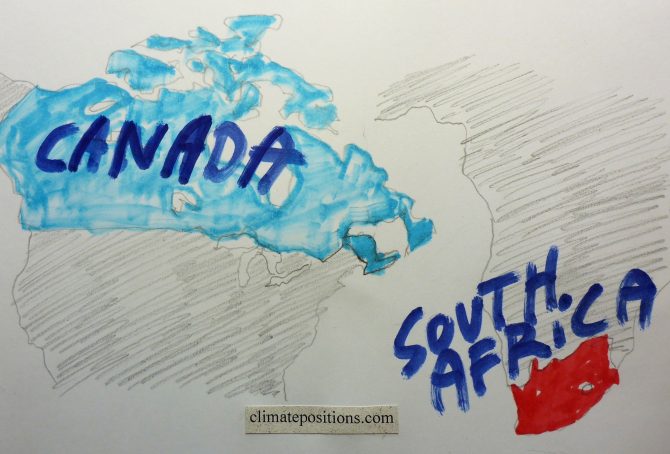
Climate change performance: Canada vs. South Africa
2017
Canada and South Africa are the world’s 13th and 14th largest emitters of CO2 from Fossil Fuels and cement. Combined, the two countries were responsible for 2.6% of world CO2 Emissions in 2015. The following examines the ‘Indicators‘ of CO2 Emissions, GDP(ppp-$), Ecological Footprint and Nuclear Power.
The diagrams below show the per capita CO2 Emissions from Fossil Fuel (without bunkers) and cement, since 2000. The green bars show the Free Emission Level¹ – the exceedance is the basis for calculating the national Climate Debt. Canada’s emissions from coal decreased by 41.3% between 2000 and 2014 (coal caused 13% of the CO2 Emissions from Fossil Fuels in 2014). South Africa’s emissions from coal increased by 6.4% between 2010 and 2014 (coal caused 83% of the CO2 Emissions from Fossil Fuels in 2014).
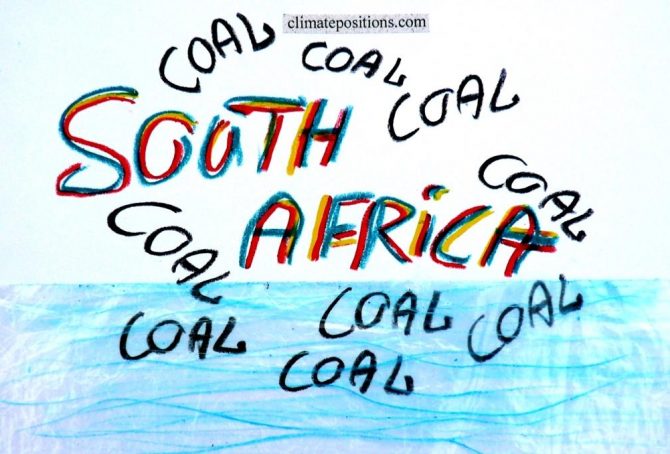
South Africa – the world’s 13th largest CO2 emitter (coal, coal and more coal … and inequality)
South Africa populates 0.7% of the planet’s people and emits 1.3% of the world’s CO2 from fossil fuels (without bunkers) and cement production. The Climate Debt of the 54 million South African’s amounts to $39 billion, or $720 per capita, and the ‘Ranking’ was 42nd among 148 countries by January 2016 – in 2010 the ranking was 45th.
The first diagram shows South Africa’s per capita CO2 Emissions from fossil fuels (without bunker fuels) and cement production in decades in comparison with the world average. CO2 Emissions 2012-2014 are preliminary estimates. The green bars are the Contribution Free Level, determined by the level of CO2 Emissions in the 1990s and a number of continuously updated ‘Indicators’.

Climate Debt: Australia ranks 8th (performance of the twenty largest coal producers)
2016
Australia covers around 5.7% of planet’s land area and populates 0.3% of its people. The Climate Debt of the 24 million Australian’s amounts to $132 billion, or $5,613 per capita, which ‘Ranks’ Australia 8th among 148 countries – in 2010 the ranking was 6th. Australia is the world’s 5th largest coal producer and the 2nd largest per capita CO2 emitter from coal combustion … and coal is the most efficient climate destroyer. The table below reveals some key figures of the world’s twenty largest coal producers. Subsequently, Australia’s climate change performance is examined in comparison with four other top-five countries on CO2 Emissions from coal combustion (per capita): Kazakhstan (ranked 1), South Africa (3), the United States (4) and Poland (5).

Preliminary Carbon Dioxide Emissions 2014, by country
2015
’The Global Carbon Project’ at Carbon Dioxide Information Analysis Center (CDIAC) has published preliminary CO2 Emissions from fossil fuels and cement for 2014, for more than 200 countries. The data is being used in a preliminary calculation of accumulated Climate Debt in ClimatePositions¹. The table below shows the estimated per capita emissions plus the updated Climate Debts, of the twenty largest total emitters (responsible for 77% of the global emissions in 2014).
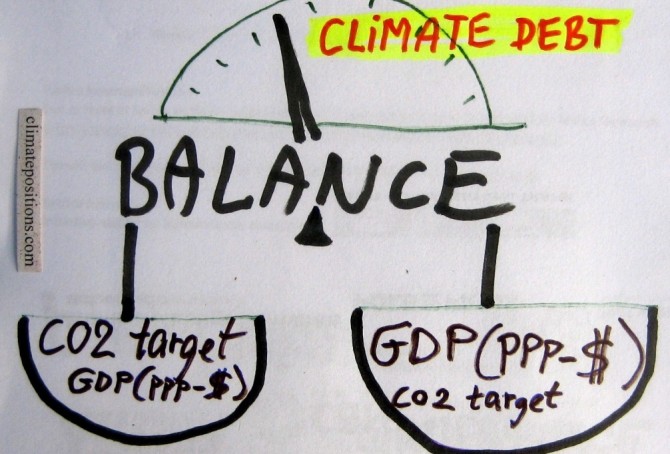
Analyses of the global CO2 target and GDP(ppp-$)
2015
The calculation of Climate Debt in ClimatePositions is based on a balance between many ‘indicators’ and a common global per capita CO2 target. To illustrate the nature of this balance twelve countries are analyzed in this article in terms of the indicator of GDP(ppp-$) and the global CO2 target. The 12-Countries Group represents 38% of the global population, 65% of the global CO2 Emissions from fossil fuels and around 70% of the global Climate Debt.
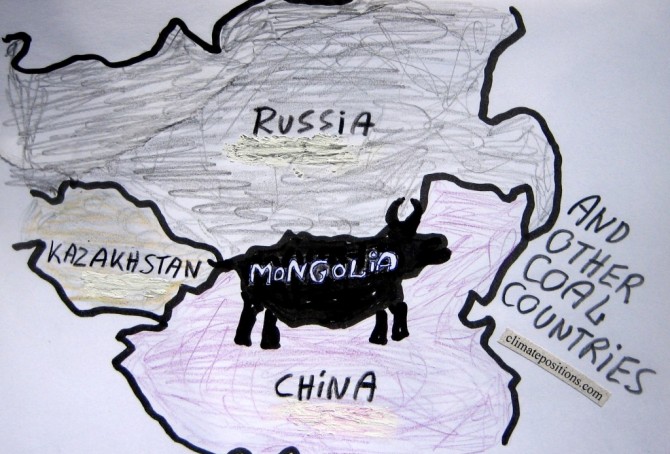
Mongolia and other coal producing countries (the thirteen most coal-dependent countries)
2015
Mongolia is the world’s second largest coal producer per capita (Btu, 2011) and coal is the world’s no. 1 carbon dioxide emitter. However, the flawed democracy (surrounded by the giant authoritarian regimes of China and Russia) is Contribution Free (no Climate Debt) in ClimatePositions – how is this possible?
The table below ranks the thirteen largest per capita coal producers (Btu, 2011), with the world average set at 1.0. The Mongolian coal production is almost ten times larger than the world average. For comparison, the table shows per capita values of CO2 Emissions (from fossil fuels), GDP(ppp-$) and Climate Debt. More comments below the table.
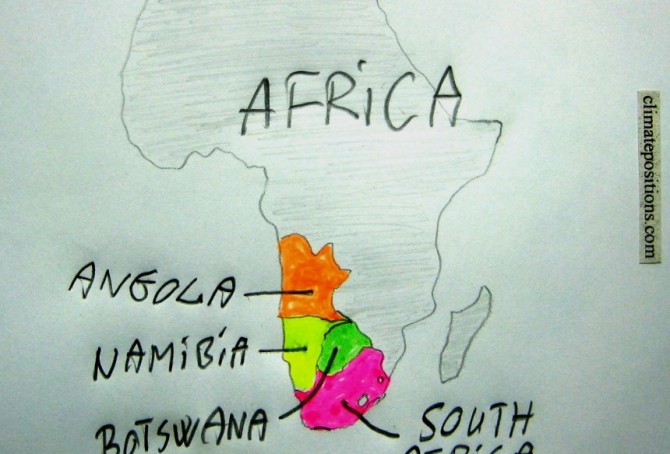
Climate change performance of South Africa, Botswana, Angola and Namibia
2015
36 out of 44 African countries in ClimatePositions are Contribution Free and the total climate debt of the African continent is 1.1% of the global climate debt – the share of the global population and CO2 Emissions from fossil fuels is respectively around 13.8% and 3.7%. The eight countries ranked below stand out in Africa by having a climate debt. This article analyses the performance of South Africa, Botswana, Angola and Namibia.
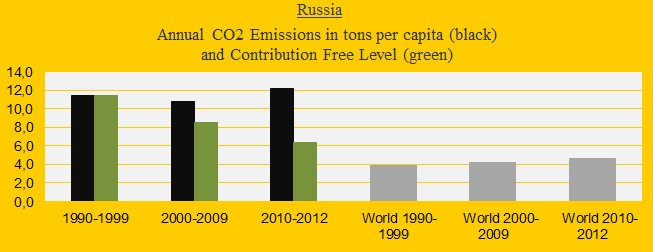
Climate change performance of Russia (compared to other BRICS countries)
2014
Russia was the 4th largest carbon dioxide emitter in 2012 with 5.6% of the global emissions, after China (26.9%), the United States (16.6%) and India (5.8%). The first diagram shows Russia’s CO2 Emissions per capita in decades in comparison with the world average (the green bars are the Contribution Free Level). After the COP summit in 2009 (at which China and the United States rejected a globally binding reduction agreement) the Russian emissions have increased dramatically and today the Russian Climate Contribution (climate debt) is $1,410 per capita (ranked 28th), compared to $627 in 2010 (ranked 32nd). See the ‘ranking’. The following analyzes the development in Putin’s Russia since 2000 in comparison with the other ‘BRICS‘ countries China, India, Brazil and South Africa – jointly emitting 41% of global carbon dioxide in 2012.
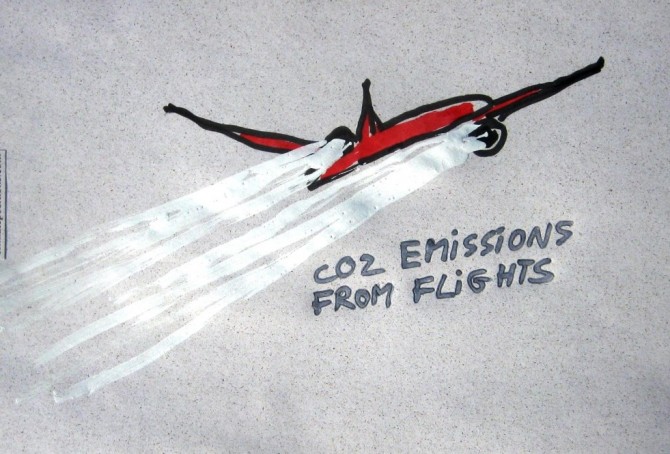
CO2 Emissions from flights
2014
Since the early 1990s the passenger-kilometers of flights worldwide has increased by 5-6% per year. The CO2 Emissions (carbon dioxide) per passenger kilometer vary due to difference in flight distances¹, aircrafts and load factors (percent of occupied seats) – with average load factors First Class and Business Class are causing nine- and three-times higher emissions per passenger than Economy Class, as one study suggests². Furthermore the mixed exhaust from flights causes 2-4 times more global warming than only CO2 emitted from engines on the ground³. The accumulated climate-effect from flights might be as high as 7-9% of the total effect from anthropogenic greenhouse gases4. However, the following examines only the CO2 Emissions from flights and the implied national costs in Climate Contributions (climate debt). But first see these three seductive animations (from ‘nats‘) with 24-hours flights over ‘Europe 1:59‘, ‘Middle East 1:11‘ and ‘North Atlantic 1:52‘.
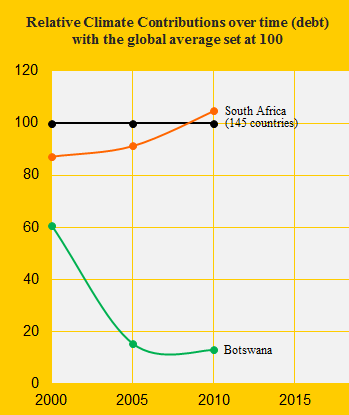
Climate performance: South Africa versus Botswana
2014
South Africa was the 38th worst performing country out of 145 in ClimatePositions 2010 while the neighboring Botswana was the 60th. The Climate Contributions (climate debt) were respectively $448 and $69 per capita (with the latest updates the amounts have increased to $592 and $84 per capita). See the relative Contributions in 2000, 2005 and 2010 in the diagram with the global average set at 100. Below we highlight some of the national indicators in the calculations.