Canada – per capita Fossil CO2 Emissions and Climate Debt
2020
Canada’s current Climate Breakdown Pricing amounts to $29.84 per tons Fossil CO2 emitted since 2000. The Climate Debt grew from $6,452 per capita in 2015 to $9,685 in 2020. Updated Rankings of 165 countries are available in the menu “Climate Debt”.
The following diagrams expose the trends of Fossil CO2 Emissions, Climate Debt, GDP(ppp-$), Nuclear Power and Ecological Footprint without carbon.
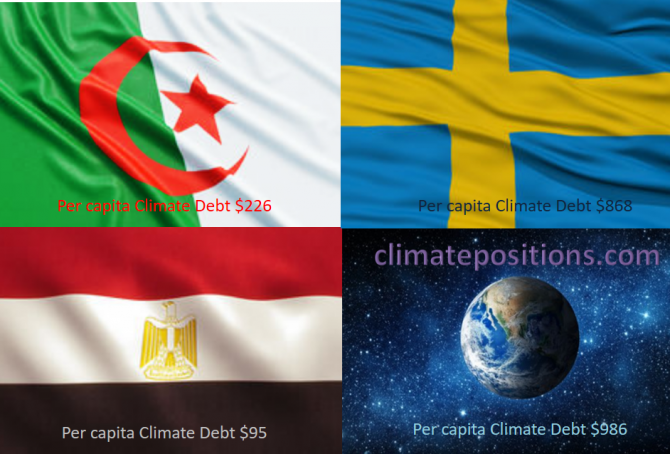
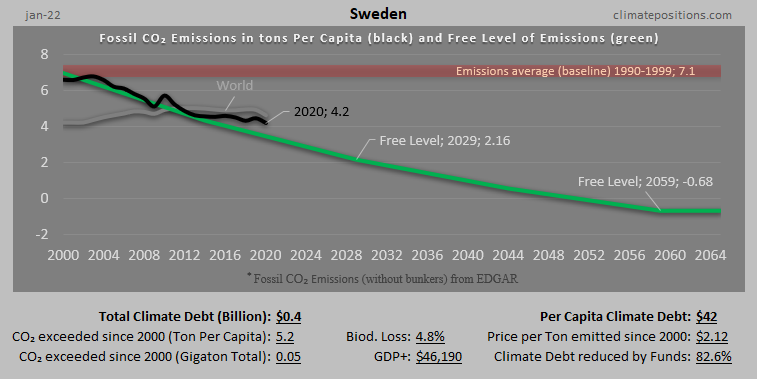
Share of global Climate Debt rank 46th, 47th and 48th: Algeria, Egypt and Sweden (combined responsible for 0.37% of Climate Debt and 1.18% of Fossil CO2 Emissions 2016)
2017
The diagram below shows ‘Share of global Climate Debt‘ in 2010, 2015 and 2017 of Algeria, Egypt and Sweden (ranked 46th, 47th and 48th). The Algerian share has increased continuously, whereas the Egyptian and the Swedish shares appear to have peaked around 2015.
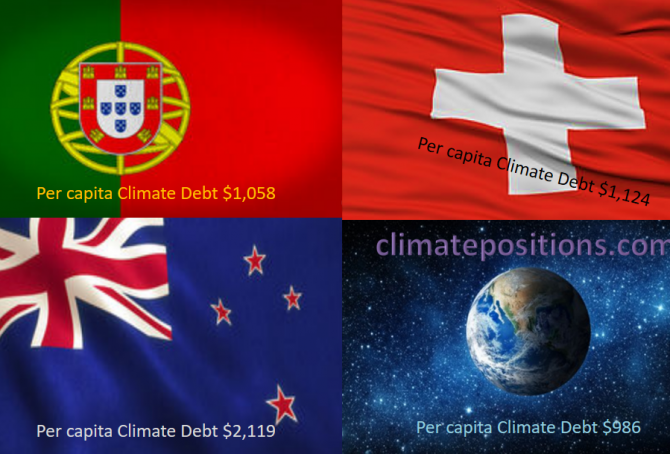
Share of global Climate Debt rank 43rd, 44th and 45th: Portugal, New Zealand and Switzerland (combined responsible for 0.42% of Climate Debt and 0.34% of Fossil CO2 Emissions 2016)
2017
The diagram below shows ‘Share of global Climate Debt‘ in 2010, 2015 and 2017 of Portugal, New Zealand and Switzerland (ranked 43rd, 44th and 45th). The shares of Portugal and New Zealand are decreasing, whereas the Swiss share is stable.

Global Carbon Project (CDIAC), located in the United States, stops publishing carbon emissions data by country – will be replaced by EDGAR in ClimatePositions
2017
The Carbon Dioxide Information Analysis Center (CDIAC), located at the U.S. Department of Energy’s (DOE) Oak Ridge National Laboratory, has published annual Carbon Emissions from Fossil Fuels and cement production by country since 1959 (‘Global Carbon Project‘), but now this continuous time series has come to an end and 2015 will be the last data-year (as it seems).
Since carbon emissions data from CDIAC (Global Carbon Project) is the core ‘Indicator‘ in ClimatePositions’ calculation of Climate Debt, carbon emissions data will be replaced with nearly similar data from ‘EDGAR‘ (‘European Commission‘ / ‘Climate Action‘), retroactively since 1990, in connection with the coming updates [done 16-08-2017].
The following describes the differences between CO2 Emissions data from Global Carbon Project (CDIAC) and EDGAR (sourced: European Commission, Joint Research Centre (JRC)/Netherlands Environmental Assessment Agency (PBL). Emission Database for Global Atmospheric Research (EDGAR)), and the consequences in terms of Climate Debt in ClimatePositions – illustrated with a range of country examples. Note that other sources, such as ‘IEA‘, ‘EIA‘ and ‘BP‘, provides CO2 Emissions data-sets different from the ones of CDIAC and EDGAR.
Climate change performance: Turkey vs. Italy
2017
Turkey and Italy are the world’s 17th and 18th largest emitters of CO2 from Fossil Fuels and cement. Combined, the two countries were responsible for 2.0% of world CO2 Emissions in 2015. The following examines the ‘Indicators‘ of CO2 Emissions, GDP(ppp-$) and Forest Cover (including Primary Forest).
The diagrams below show the per capita CO2 Emissions from Fossil Fuel (without bunkers) and cement, since 2000. The green bars show the Free Emission Level¹ – the exceedance is the basis for calculating the national Climate Debt.

Climate Debt: Norway ranks 9th (performance of top twenty from Human Development Index)
The so called ‘Human Development Index 2015’ (UN) ranks Norway 1st among 188 countries. The index is based on 1) Life expectancy at birth, 2) Expected years of schooling, 3) Mean years of schooling and 4) Gross national income (GNI) per capita. However, the wealthy Scandinavian oil state ‘Ranks‘ 9th among 148 countries on Climate Debt per capita. Norway is in other words a highly human developed demolisher of the climate, one might say! The following examines the climate performance of Norway in comparison with the other top five countries from Human Development Index: Australia, Switzerland, Denmark and Netherland.
Canada now ranks 10th in Climate Debt per capita (due to black transition)
Canada covers 7.3% of planet’s land area and populates 0.5% of its people. The Climate Debt of the 35 million Canadians amounts to $183 billion, or $5,138 per capita, which ‘Ranks’ Canada 10th among 148 countries. In 2010 the ranking was 7th. The following compares the Canadian performance with the ones of Australia, New Zealand, Sweden and Finland – all wealthy developed countries with small or relatively small population density¹.
Sweden beats Finland in climate change performance
2015
Finland’s updated Climate Debt is $2,624 per capita and Sweden’s is $1,003. The ‘2014-rankings’ were 18th and 37th among 147 countries. The following examines the indicators of CO2 Emissions from fossil fuels, Nuclear Power, GDP(ppp-$), Climate Debt as a percentage of GDP(ppp-$) and Forest Cover.
Forest Cover, Primary Forests and climate debt
2014
The national data of Forest Cover and Primary Forest are both included in the calculations of Climate Contributions (debt) in ClimatePositions. Primary Forest was included as an indicator in the worksheet in August 2014. The following describes selected findings on forests from FAO’s ‘The Global Forest Resources Assessments (FRA), 2010’ (main report, pdf, 378 pages). The Assessment is based on two primary sources of data: 1) ‘country reports’ and 2) remote sensing conducted by FAO and partners.
Nuclear Power updates 2013
2014
The world’s Nuclear Power generation increased marginally in 2013 compared to 2012. The last four years of generated global nuclear electricity was:
- 2010: 2,629 billion kWh
- 2011: 2,516 billion kWh
- 2012: 2,346 billion kWh
- 2013: 2,359 billion kWh
Sweden with Nuclear Power and Norway with oilfields
2014
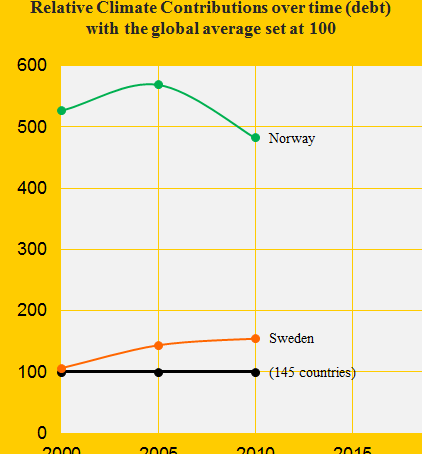
In ClimatePositions 2010, Norway was the 14th worst performing country – Sweden was number 30. See the relative Contributions per capita over time in the diagram. Norway, with only 0.07% of the world’s population, produces 2.80% of the world’s oil (crude extracted from reserves). In 2011, Norway was the world’s 14th largest oil producer. The neighboring country Sweden has no oil production but has the world’s largest Nuclear Power generation per capita.
The following examines the indicators: CO2 Emissions, Ecological Footprint, GDP(ppp-$) and Nuclear Power.
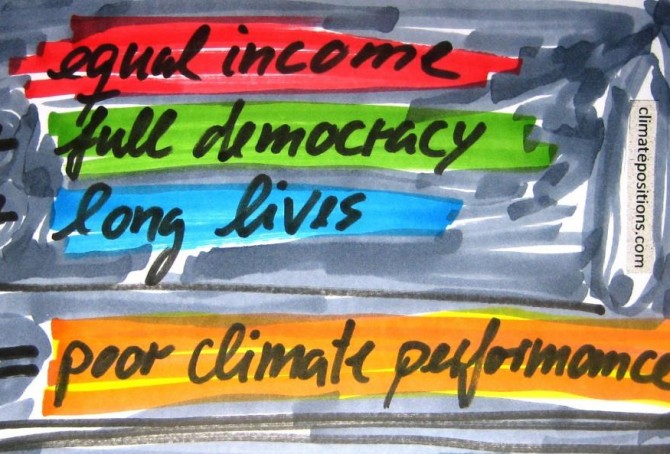
Income Equality, Life Expectancy, Democracy Index … and Climate Contributions
2014
123 out of 145 countries with full data in ClimatePositions are included in an inventory of Income Equality (see the source at the bottom), which shows how much the 10% poorest earns compared to the 10% richest. 53 out of the 123 countries are Contribution Free (no climate debt) in ClimatePositions 2010 and 70 countries are not.
The table below shows the difference between the two groups of countries in terms of Income Equality, Life Expectancy, number of Full Democracies and number of Authoritarian Regimes. To clarify the trend the 20 countries with the largest Climate Contributions appear at the top of the table. The 123 countries represent 95% of the world population.
Climate Change Performance Index 2013
2013
‘Climate Change Performance Index 2013’ is a ranking of 58 countries that was published recently by ‘Germanwatch’ and ‘Climate Action Network Europe’ – with the help of over 230 experts worldwide. 80% of the evaluation is based on indicators of emissions (30% for emissions levels and 30% for recent development of emissions), efficiency (5% level of efficiency and 5% recent development in efficiency) and renewable energy (8% recent development and 2% share of total primary energy supply). For the first time emissions from deforestation is included. The remaining 20% of the evaluation is based on national and international climate policy assessments by experts from the respective countries.