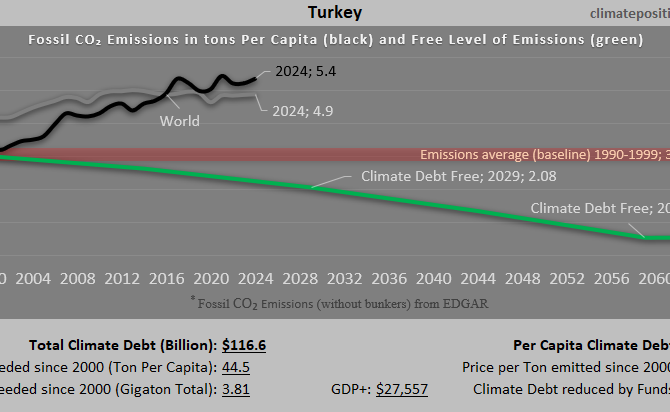
Climate Debt of Turkey 2025: $117 Billion or 1.3% of the Global Climate Debt (or $1364 Per Capita)
/2025/ Turkey ranks 42nd in Climate Debt Per Capita accumulated 2000-2025. Below are some key figures in the calculations. The diagram above shows the Fossil CO2 Emissions Per Capita and the Free Level of emissions (green). The wide straight red line shows emissions in the 1990s (baseline in the calculations).
Turkey: Per Capita Climate Debt $1,093 (Ranked 46) – Fossil CO2 Emissions
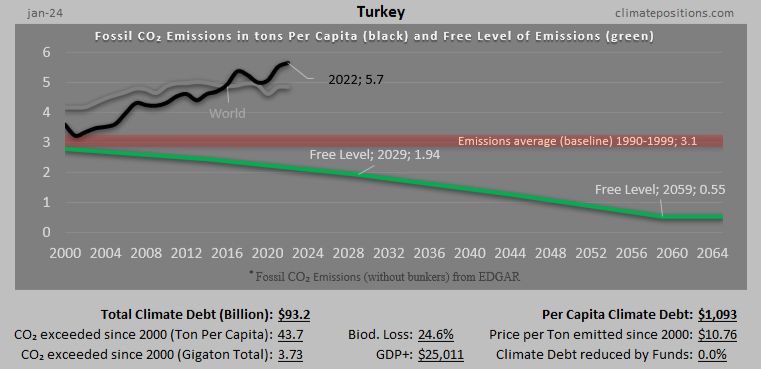
In 2024, Turkey is responsible for 1.19% of the Global Climate Debt accumulated since 2000. Below are some key figures in the calculations.
Greece – per capita Fossil CO2 Emissions and Climate Debt
2020
The current Climate Breakdown Pricing of Greece amounts to $12.76 per tons Fossil CO2 emitted since 2000. The Climate Debt grew from $1,256 per capita in 2015 to $1,929 in 2020. Updated Rankings of 165 countries are available in the menu “Climate Debt”.
The following diagrams expose the trends of Fossil CO2 Emissions, Climate Debt, GDP(ppp-$) and Ecological Footprint without carbon.

Turkmenistan – per capita Fossil CO2 Emissions and Climate Debt
2020
Turkmenistan’s current Climate Breakdown Pricing amounts to $12.37 per tons Fossil CO2 emitted since 2000. The Climate Debt grew from $1,300 per capita in 2015 to $2,799 in 2020. Updated Rankings of 165 countries are available in the menu “Climate Debt”.
The following diagrams expose the trends of Fossil CO2 Emissions, Climate Debt, GDP(ppp-$) and Ecological Footprint without carbon.

Iraq – per capita Fossil CO2 Emissions and Climate Debt
2020
Iraq’s current Climate Breakdown Pricing amounts to $4.04 per tons Fossil CO2 emitted since 2000. The Climate Debt grew from $66 per capita in 2015 to $303 in 2020. Updated Rankings of 165 countries are available in the menu “Climate Debt”.
The following diagrams expose the trends of Fossil CO2 Emissions, Climate Debt, GDP(ppp-$) and Ecological Footprint without carbon.
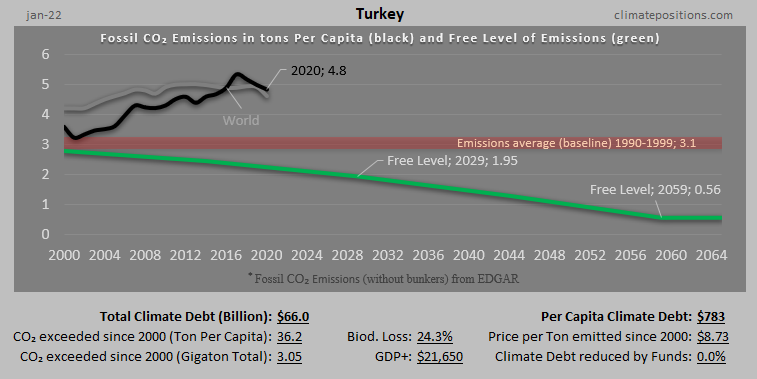
Turkey – per capita Fossil CO2 Emissions and Climate Debt
2020
Turkey’s current Climate Breakdown Pricing amounts to $13.04 per tons Fossil CO2 emitted since 2000. The Climate Debt grew from $401 per capita in 2015 to $1,040 in 2020. Updated Rankings of 165 countries are available in the menu “Climate Debt”.
The following diagrams expose the trends of Fossil CO2 Emissions, Climate Debt, GDP(ppp-$) and Ecological Footprint without carbon.

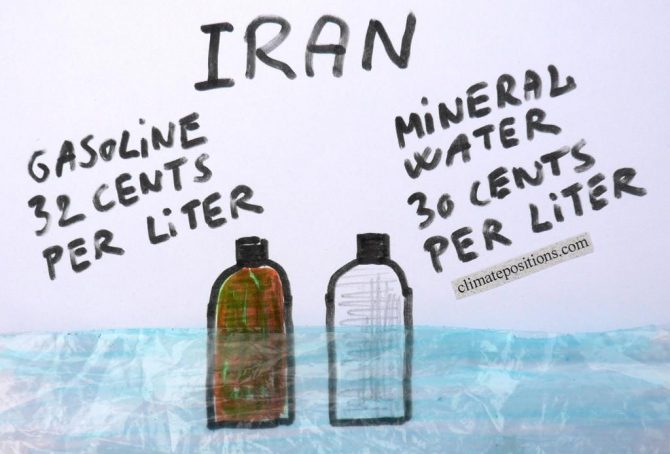
Iran – per capita Fossil CO2 Emissions and Climate Debt
2020
Iran’s current Climate Breakdown Pricing amounts to $15.69 per tons Fossil CO2 emitted since 2000. The Climate Debt grew from $1,095 per capita in 2015 to $2,153 in 2020. Updated Rankings of 165 countries are available in the menu “Climate Debt”.
The following diagrams expose the trends of Fossil CO2 Emissions, Climate Debt, GDP(ppp-$), Ecological Footprint (without carbon) and Nuclear Power.
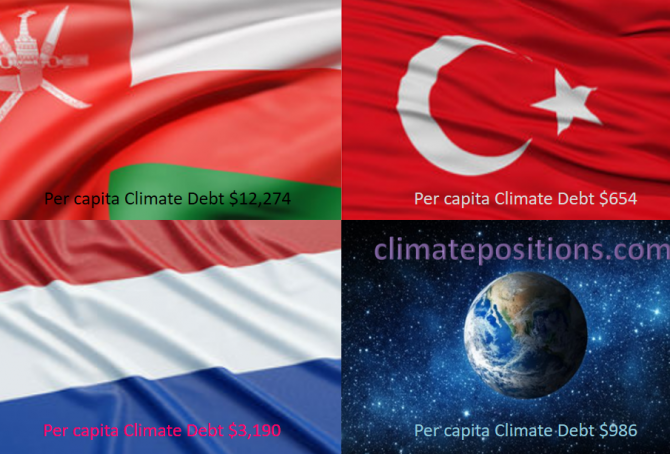
Share of global Climate Debt rank 19th, 20th and 21st: Oman, Netherlands and Turkey (combined responsible for 2.2% of Climate Debt and 1.7% of Fossil CO2 Emissions 2016)
2017
The diagram below shows ‘Share of global Climate Debt‘ in 2010, 2015 and 2017 of Oman, Netherlands and Turkey (ranked 19th, 20th and 21st). The share Netherlands is decreasing steadily, whereas Turkey’s is increasing.
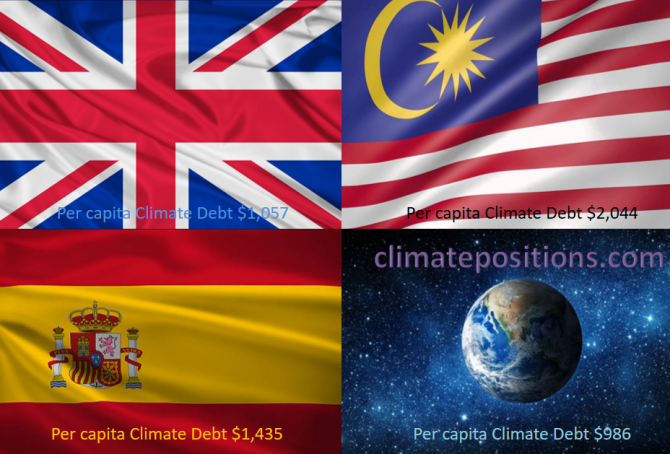
Share of global Climate Debt rank 16th, 17th and 18th: The United Kingdom, Spain and Malaysia (combined responsible for 2.8% of Climate Debt and 2.5% of Fossil CO2 Emissions 2016)
2017
The diagram below shows ‘Share of global Climate Debt‘ in 2010, 2015 and 2017 of the United Kingdom, Spain and Malaysia (ranked 16th, 17th and 18th). The shares of the United Kingdom and Spain are decreasing, while the Malaysian share is increasing.
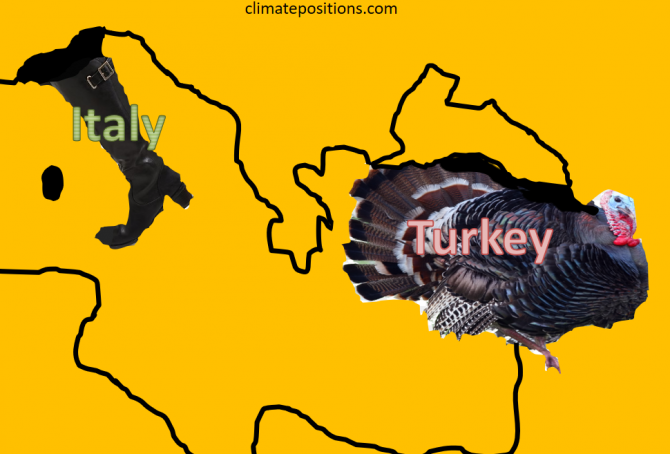
Climate change performance: Turkey vs. Italy
2017
Turkey and Italy are the world’s 17th and 18th largest emitters of CO2 from Fossil Fuels and cement. Combined, the two countries were responsible for 2.0% of world CO2 Emissions in 2015. The following examines the ‘Indicators‘ of CO2 Emissions, GDP(ppp-$) and Forest Cover (including Primary Forest).
The diagrams below show the per capita CO2 Emissions from Fossil Fuel (without bunkers) and cement, since 2000. The green bars show the Free Emission Level¹ – the exceedance is the basis for calculating the national Climate Debt.
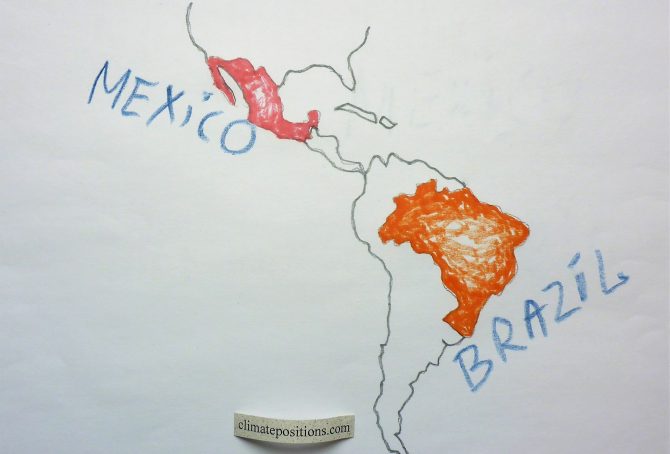
Climate change performance: Brazil vs. Mexico
2017
Brazil and Mexico are the world’s 11th and 12th largest emitters of CO2 from Fossil Fuels and cement. Combined, the two countries were responsible for 2.8% of world CO2 Emissions in 2015. The following examines the ‘Indicators‘ of CO2 Emissions, GDP(ppp-$), Forest Cover, Primary Forest and Ecological Footprint (without carbon footprint).
The diagrams below show the per capita CO2 Emissions from Fossil Fuel (without bunkers) and cement, since 2000. The green bars show the Free Emission Level¹ – the exceedance is the basis for calculating the national Climate Debt.
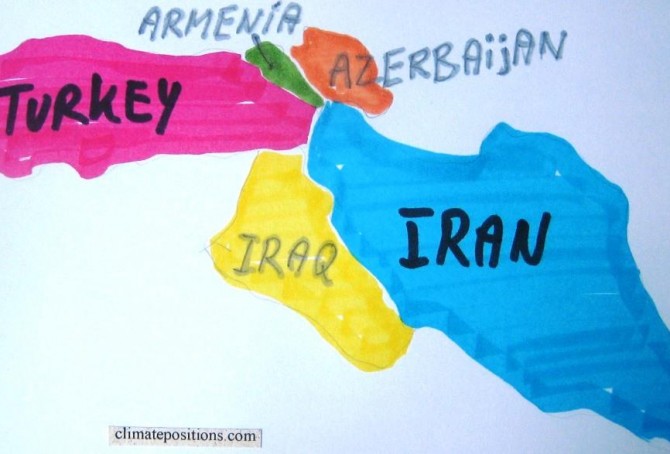
Climate Debt: Iran ranks 33rd (performance of the twenty most populous Muslim countries)
The twenty most populous countries with more than 85% Muslim majority (here called Muslim-20) represent 16.2% of the global population and 7.3% of the global Climate Debt in ClimatePositions. The average climate performance of the Muslim world is superior to the world average, so to speak. Among Muslim-20 Iran ranks 2nd (33rd among 148 countries) on Climate Debt per capita only surpassed by the climate-change-monster of Saudi Arabia.

Climate Debt: Australia ranks 8th (performance of the twenty largest coal producers)
2016
Australia covers around 5.7% of planet’s land area and populates 0.3% of its people. The Climate Debt of the 24 million Australian’s amounts to $132 billion, or $5,613 per capita, which ‘Ranks’ Australia 8th among 148 countries – in 2010 the ranking was 6th. Australia is the world’s 5th largest coal producer and the 2nd largest per capita CO2 emitter from coal combustion … and coal is the most efficient climate destroyer. The table below reveals some key figures of the world’s twenty largest coal producers. Subsequently, Australia’s climate change performance is examined in comparison with four other top-five countries on CO2 Emissions from coal combustion (per capita): Kazakhstan (ranked 1), South Africa (3), the United States (4) and Poland (5).

Preliminary Carbon Dioxide Emissions 2014, by country
2015
’The Global Carbon Project’ at Carbon Dioxide Information Analysis Center (CDIAC) has published preliminary CO2 Emissions from fossil fuels and cement for 2014, for more than 200 countries. The data is being used in a preliminary calculation of accumulated Climate Debt in ClimatePositions¹. The table below shows the estimated per capita emissions plus the updated Climate Debts, of the twenty largest total emitters (responsible for 77% of the global emissions in 2014).
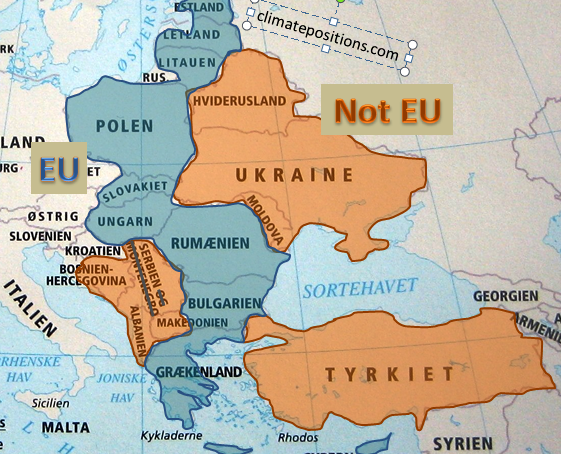
European Union “east” compared to bordering countries
2015
The ‘European Union’ (EU) is an economic and political partnership between ‘28 countries’. Around 7% of the global population lives in EU and they emit around 12% of the global CO2 from fossil fuels and are responsible of 13% of the Climate Debt in ClimatePositions. The following examines a group of 10 countries in eastern EU which joined the union between 1981 and 2007 in comparison with 8 bordering countries.

Climate change performance: Turkey vs. Egypt
2015
Turkey is ranked 57th and Egypt 71st among 147 countries on the list of the worst performing countries in ClimatePositions. See the ‘ranking’. The Turkish Climate Debt accumulated since 2000 increased from $161 per capita in 2010 to $324 in the latest calculation, while the one of Egypt increased from $40 to $73. The first diagram shows the relative Climate Debt of the two countries in comparison with Lebanon, Jordan and China, with the world average set at 100. Note that the world’s average Climate Debt increased from $455 per capita in 2010 to $769 in 2014 (reflecting the growing CO2 Emissions from fossil fuels and the growing economy). The following examines some indicators and trends of Turkey and Egypt.
Climate change performance: Iran versus Turkey
2014
The CO2 Emissions of the authoritarian Islamic regime Iran have doubled from 4.0 tons per capita in the 1990s to 8.0 tons in 2011, while the Turkish emissions have increased from 2.5 tons in the 1990s to 3.8 tons in 2011. See the emissions since 2000 in the two diagrams below.

Putin’s Russia is deteriorating ecologically
2013
Russia was the world’s third largest CO2 Emitter (carbon dioxide) in 2006-2010 and the authoritarian regime was the 31st worst performing country in ClimatePositions 2010. In 2005 the ranking was 34th and in 2000 43rd. The negative development under Putin is unquestionable.