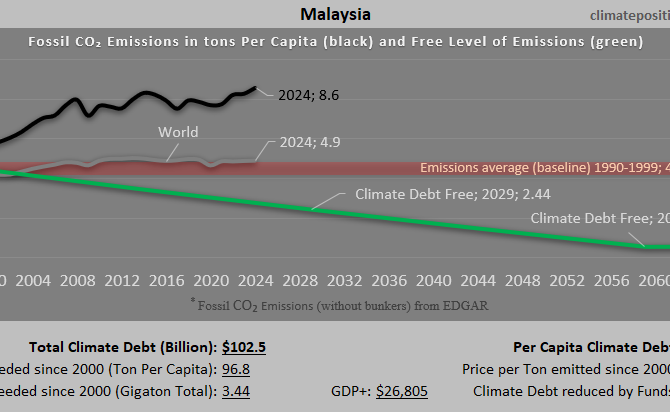
Climate Debt of Malaysia 2025: $102 Billion or 1.1% of the Global Climate Debt (or $2882 Per Capita)
/2025/ Malaysia ranks 22nd in Climate Debt Per Capita accumulated 2000-2025. Below are some key figures in the calculations. The diagram above shows the Fossil CO2 Emissions Per Capita and the Free Level of emissions (green). The wide straight red line shows emissions in the 1990s (baseline in the calculations).
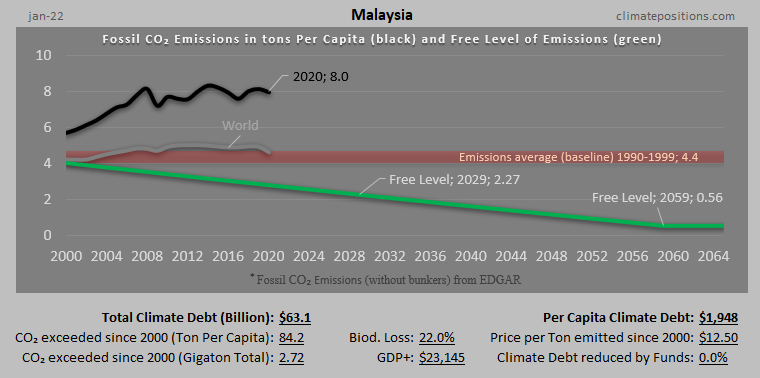
Malaysia: Per Capita Climate Debt $2,145 (Ranked 29) – Fossil CO2 Emissions

In 2024, Malaysia is responsible for 0.93% of the Global Climate Debt accumulated since 2000. Below are some key figures in the calculations.

Malaysia – per capita Fossil CO2 Emissions and Climate Debt
2020
Malaysia’s current Climate Breakdown Pricing amounts to $20.82 per tons Fossil CO2 emitted since 2000. The Climate Debt grew from $1,454 per capita in 2015 to $2,902 in 2020. Updated Rankings of 165 countries are available in the menu “Climate Debt”.
The following diagrams expose the trends of Fossil CO2 Emissions, Climate Debt, GDP(ppp-$) and Ecological Footprint without carbon.

Thailand – per capita Fossil CO2 Emissions and Climate Debt
2020
Thailand’s current Climate Breakdown Pricing amounts to $7.92 per tons Fossil CO2 emitted since 2000. The Climate Debt grew from $265 per capita in 2015 to $535 in 2020. Updated Rankings of 165 countries are available in the menu “Climate Debt”.
The following diagrams expose the trends of Fossil CO2 Emissions, Climate Debt, GDP(ppp-$) and Ecological Footprint without carbon.
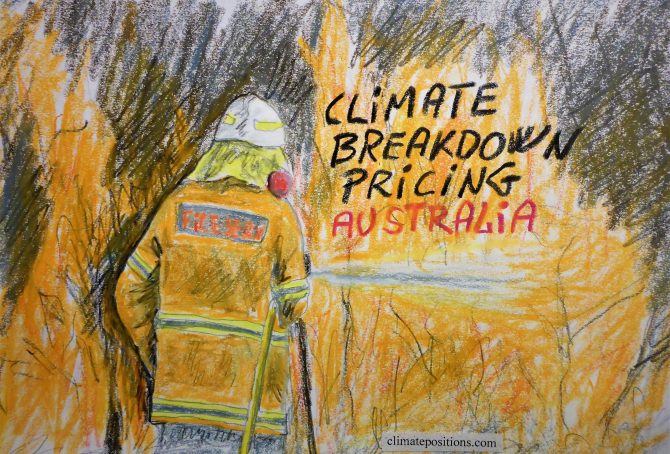
Australia – per capita Fossil CO2 Emissions and Climate Debt
2020
Australia’s current Climate Breakdown Pricing amounts to $32.40 per tons Fossil CO2 emitted since 2000. The Climate Debt grew from $6,547 per capita in 2015 to $11,256 in 2020. Updated Rankings of 165 countries are available in the menu “Climate Debt”.
The following diagrams expose the trends of Fossil CO2 Emissions, Climate Debt, GDP(ppp-$) and Ecological Footprint without carbon.
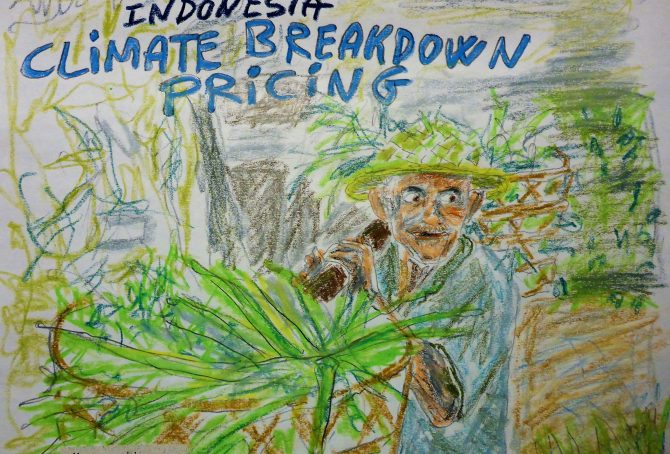
Indonesia – per capita Fossil CO2 Emissions and Climate Debt
2020
Indonesia’s current Climate Breakdown Pricing amounts to $4.50 per tons Fossil CO2 emitted since 2000. The Climate Debt grew from $82 per capita in 2015 to $147 in 2020. Updated Rankings of 165 countries are available in the menu “Climate Debt”.
The following diagrams expose the trends of Fossil CO2 Emissions, Climate Debt, GDP(ppp-$), Ecological Footprint without carbon, Forest Cover and Primary Forest.
Japan – per capita Fossil CO2 Emissions and Climate Debt
2020
Japan’s current Climate Breakdown Pricing amounts to $20.35 per tons Fossil CO2 emitted since 2000. The Climate Debt grew from $1,952 per capita in 2015 to $3,734 in 2020. Updated Rankings of 165 countries are available in the menu “Climate Debt”.
The following diagrams expose the trends of Fossil CO2 Emissions, Climate Debt, GDP(ppp-$), Nuclear Power and Ecological Footprint without carbon.
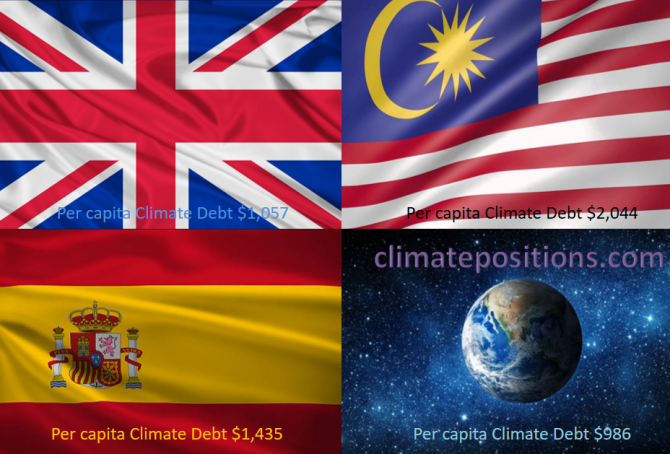
Share of global Climate Debt rank 16th, 17th and 18th: The United Kingdom, Spain and Malaysia (combined responsible for 2.8% of Climate Debt and 2.5% of Fossil CO2 Emissions 2016)
2017
The diagram below shows ‘Share of global Climate Debt‘ in 2010, 2015 and 2017 of the United Kingdom, Spain and Malaysia (ranked 16th, 17th and 18th). The shares of the United Kingdom and Spain are decreasing, while the Malaysian share is increasing.
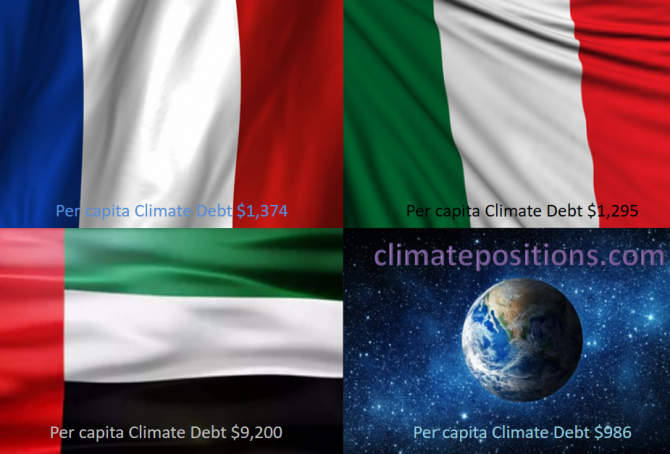
Share of global Climate Debt rank 13th, 14th and 15th: France, United Arab Emirates and Italy (combined responsible for 3.5% of Climate Debt and 2.5% of Fossil CO2 Emissions 2016)
2017
The diagram below shows ‘Share of global Climate Debt‘ in 2010, 2015 and 2017 of France, United Arab Emirates and Italy (ranked 13th, 14th and 15th). The share of United Arab Emirates has increased along with an extreme population growth.

Climate change performance: Malaysia vs. Spain
2017
Malaysia and Spain are the world’s 23rd and 24th largest emitters of CO2 from Fossil Fuels and cement. Combined, the two countries were responsible for 1.4% of world CO2 Emissions in 2015. The following examines the ‘Indicators‘ of CO2 Emissions, GDP(ppp-$), Forest Cover (and Primary Forest) and Environmental Performance.
The diagrams below show the per capita CO2 Emissions from Fossil Fuel (without bunkers) and cement, since 2000. The green bars show the Free Emission Level¹ – the exceedance is the basis for calculating the national Climate Debt. The Spanish reductions are pretty much balanced by the Malaysian increases … which is world symptomatic.
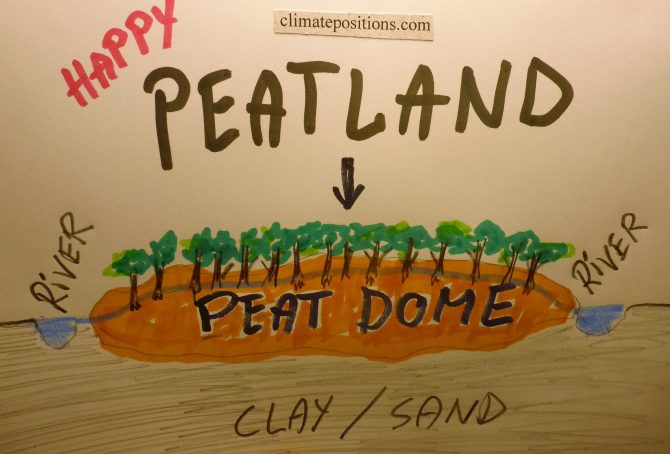
Climate change performance: South Korea vs. Indonesia (peatlands in Southeast Asia)
2017
In 2015 South Korea and Indonesia accounted for 3.60% and 0.51% of the global Climate Debt, respectively (see the ‘Ranking‘). The following examines the ‘Indicators‘ of CO2 Emissions, GDP(ppp-$), Forest Cover (and peatlands) and Primary Forest.
The first two diagrams show the per capita CO2 Emissions from Fossil Fuel (without bunkers) and cement, annually since 2000, of South Korea and Indonesia. The green bars show the Free Emission Level¹ – the exceedance is the basis for calculating the national Climate Debt. The world’s 9th and 10th largest CO2-emitters were responsible for 1.7% (South Korea) and 1.5% (Indonesia) of global emissions in 2015, respectively. South Korea’s per capita emissions were 11.7 tons in 2015 (preliminary), while Indonesia’s were 2.1 tons (preliminary), which was 2.2% above the 2014-level.
Climate change performance of Malaysia, Thailand, Indonesia and the Philippines
2015
6.4% of the world population lives in Malaysia, Thailand, Indonesia or the Philippines – they emitted 3.2% of the global carbon dioxide from fossil fuels in 2012. The four diagrams below show the emissions per capita 2000-2013 (preliminary estimates of 2013) of the four populous countries of which only the Philippines is Contribution Free (no climate debt) in ClimatePositions. The green bars are the Contribution Free Level of CO2 Emissions calculated from emissions in 1990s and a number of continuously updated ‘indicators’.

The Philippines beats Malaysia in climate change performance (what about the rainforests?)
2014
The Philippines is Contribution Free in ClimatePositions while Malaysia was the 36th worst performing country out of 145 in 2010. In 2014, the Malaysian Climate Contribution (climate debt) increased to $997 per capita and the present ranking is 31st (see ‘here’). The first diagram (below) illustrates the typical correlation between rapid economic growth and loss of sustainability that increases climate debt. The Malaysian climate debt, computed as a percentage of GDP(ppp-$) annually since 2000 increased from 0.38% in 2010 to 0.41% in 2014 (see the ranking ‘here’). This clearly demonstrates the lack of sustainable growth. The following examines the indicators of CO2 Emissions, Ecological Footprint, Forest Area and Marine Protection of the Philippines and Malaysia.
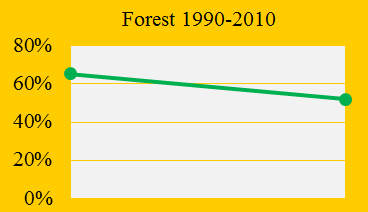
Indonesia fails on deforestation and CO2 Emissions
2013
Indonesia was the 73rd worst performing country out of 145 in ClimatePositions 2010 with a total Climate Contribution (climate debt) of 5.6 billion US$. As shown in the front diagram Indonesia cut down the total forest cover (mainly rainforest) from 65.4% in 1990 to 52.1% in 2010. Had Indonesia maintained the forest cover since 1990, then the saving in Contribution would have been 4.6 billion US$. In the updated calculation the Contribution (debt) has increased to 6.5 billion US$.
Is Singapore a climate change scoundrel?
2013
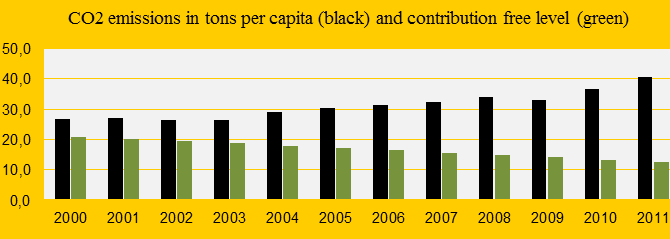
The island of Singapore was the 2nd worst performing country in ClimatePositions 2010 with a contribution (climate debt) of $9,924 per capita and there are no signs of improvement since. In the updated calculation the amount has increased to $12,364. The diagram shows the small hybrid regime’s outrageous annual CO2 Emissions (the green bars show the Contribution Free Level). Note that a large proportion of the emissions is due to marine bunkers.
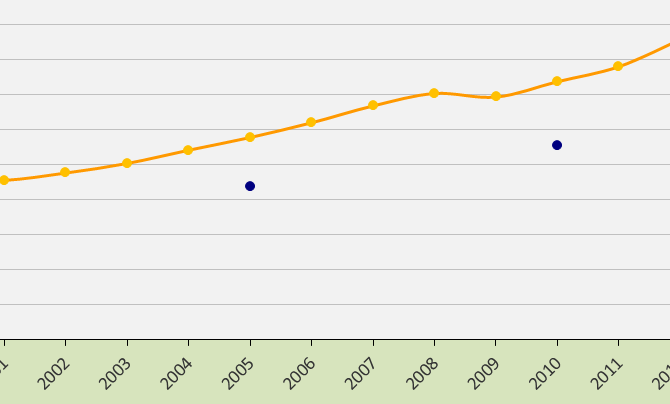
GDP growth rate in Malaysia
2013
The GDP(ppp-$) growth rate in Malaysia is higher than the global average, as illustrated in the diagram 2000-2012. Subject to modifications in the data source. The blue dots shows the global GDP(ppp-$) in 2000, 2005 and 2010. The increase in Malaysia’s prosperity causes a corresponding, but delayed, increase in the Climate Contribution (climate debt) in ClimatePositions. In 2010 Malaysia was the 38th worst performing country.