
Climate Debt of Brazil 2025: $35 Billion or 0.38% of the Global Climate Debt (or $167 Per Capita)
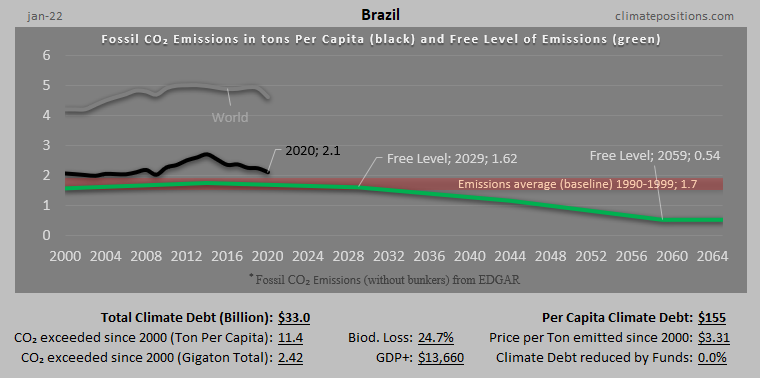
/2025/ Brazil ranks 78th in Climate Debt Per Capita accumulated 2000-2025. Below are some key figures in the calculations. The diagram above shows the Fossil CO2 Emissions Per Capita and the Free Level of emissions (green). The wide straight red line shows emissions in the 1990s (baseline in the calculations).

Colombia – per capita Fossil CO2 Emissions (zero Climate Debt)
2020
Although Colombia’s accumulated Climate Debt is zero, the country is the world’s 45th largest emitter of Fossil CO2.
The following diagrams expose the trends of Fossil CO2 Emissions, GDP(ppp-$), Forest Cover, Primary Forest and Environmental Performance.
Chile – per capita Fossil CO2 Emissions and Climate Debt
2020
Chile’s current Climate Breakdown Pricing amounts to $11.78 per tons Fossil CO2 emitted since 2000. The Climate Debt grew from $437 per capita in 2015 to $934 in 2020. Updated Rankings of 165 countries are available in the menu “Climate Debt”.
The following diagrams expose the trends of Fossil CO2 Emissions, Climate Debt, GDP(ppp-$), Forest Cover, Primary Forest and Ecological Footprint without carbon.

Venezuela – per capita Fossil CO2 Emissions and Climate Debt (economic collapse)
2020
Venezuela’s current Climate Breakdown Pricing amounts to $10.04 per tons Fossil CO2 emitted since 2000. The Climate Debt grew from $655 per capita in 2015 to $1,045 in 2020. However, once updated data on national GDP(ppp-$) is released, then the current Climate Debt will prove to be considerably smaller (more below). Updated Rankings of 165 countries are available in the menu “Climate Debt”.
The following diagrams expose the trends of Fossil CO2 Emissions, GDP(ppp-$), Climate Debt, Forest Cover, Primary Forest and Ecological Footprint without carbon.

Argentina – per capita Fossil CO2 Emissions and Climate Debt
2020
Argentina’s current Climate Breakdown Pricing amounts to $10.19 per tons Fossil CO2 emitted since 2000. The Climate Debt grew from $420 per capita in 2015 to $928 in 2020. Updated Rankings of 165 countries are available in the menu “Climate Debt”.
The following diagrams expose the trends of Fossil CO2 Emissions, Climate Debt, GDP(ppp-$) and Ecological Footprint without carbon.
Mexico – per capita Fossil CO2 Emissions and Climate Debt
2020
Mexico’s current Climate Breakdown Pricing amounts to $8.71 per tons Fossil CO2 emitted since 2000. The Climate Debt grew from $291 per capita in 2015 to $662 in 2020. Updated Rankings of 165 countries are available in the menu “Climate Debt”.
The following diagrams expose the trends of Fossil CO2 Emissions, Climate Debt, GDP(ppp-$), Nuclear Power and Ecological Footprint without carbon.
Brazil – per capita Fossil CO2 Emissions and Climate Debt
2020
Brazil’s current Climate Breakdown Pricing amounts to $5.74 per tons Fossil CO2 emitted since 2000. The Climate Debt grew from $108 per capita in 2015 to $246 in 2020. Updated Rankings of 165 countries are available in the menu “Climate Debt”.
The following diagrams expose the trends of Fossil CO2 Emissions, Climate Debt, GDP(ppp-$), Ecological Footprint without carbon, Forest Cover and Primary Forest.
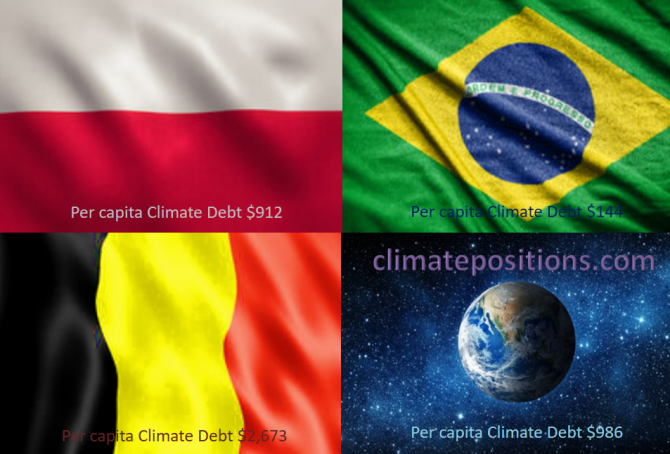
Share of global Climate Debt rank 25th, 26th and 27th: Poland, Belgium and Brazil (combined responsible for 1.3% of Climate Debt and 2.4% of Fossil CO2 Emissions 2016)
2017
The diagram below shows ‘Share of global Climate Debt‘ in 2010, 2015 and 2017 of Poland, Belgium and Brazil (ranked 25th, 26th and 27th). By 2015, the shares of the three countries were similar. Since then, the Polish performance has declined, relatively.
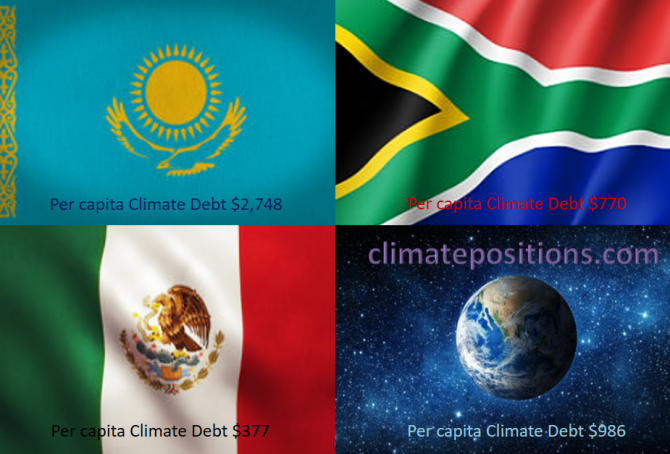
Share of global Climate Debt rank 22nd, 23rd and 24th: Kazakhstan, Mexico and South Africa (combined responsible for 1.9% of Climate Debt and 3.0% of Fossil CO2 Emissions 2016)
2017
The diagram below shows ‘Share of global Climate Debt‘ in 2010, 2015 and 2017 of Kazakhstan, Mexico and South Africa (ranked 22nd, 23rd and 24th). Kazakhstan’s share increased dramatically in a short period of time due to growing Fossil CO2 Emissions.
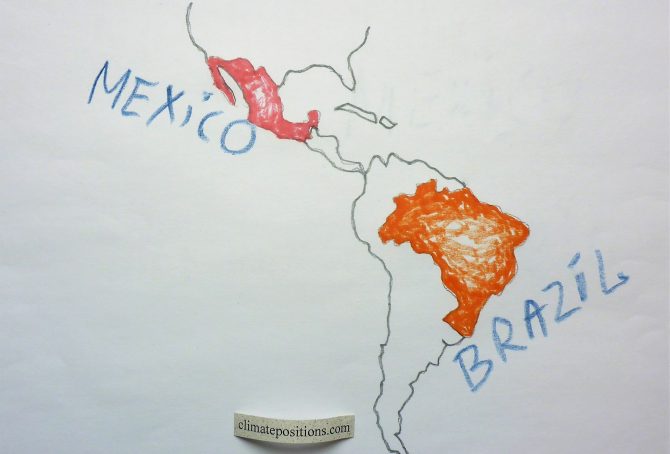
Climate change performance: Brazil vs. Mexico
2017
Brazil and Mexico are the world’s 11th and 12th largest emitters of CO2 from Fossil Fuels and cement. Combined, the two countries were responsible for 2.8% of world CO2 Emissions in 2015. The following examines the ‘Indicators‘ of CO2 Emissions, GDP(ppp-$), Forest Cover, Primary Forest and Ecological Footprint (without carbon footprint).
The diagrams below show the per capita CO2 Emissions from Fossil Fuel (without bunkers) and cement, since 2000. The green bars show the Free Emission Level¹ – the exceedance is the basis for calculating the national Climate Debt.
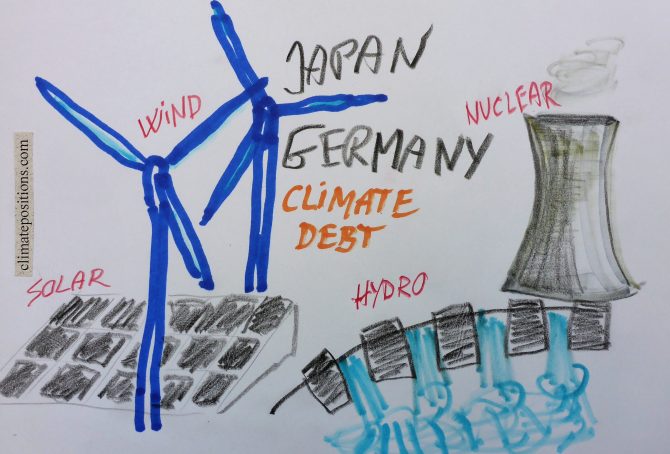
Climate change performance: Japan vs. Germany (Renewable Energy and Nuclear Power)
2016
The world’s 5th and 6th largest emitters of CO2 from Fossil Fuel (without bunkers) and cement Japan and Germany, were responsible for 3.4% and 2.1% of the global emissions in 2015. The diagrams below show the per capita CO2 Emissions, annually since 2000. The green bars show the Free Emission Level¹ – the exceedance is the basis for calculating the national Climate Debt.

Preliminary Carbon Dioxide Emissions 2014, by country
2015
’The Global Carbon Project’ at Carbon Dioxide Information Analysis Center (CDIAC) has published preliminary CO2 Emissions from fossil fuels and cement for 2014, for more than 200 countries. The data is being used in a preliminary calculation of accumulated Climate Debt in ClimatePositions¹. The table below shows the estimated per capita emissions plus the updated Climate Debts, of the twenty largest total emitters (responsible for 77% of the global emissions in 2014).
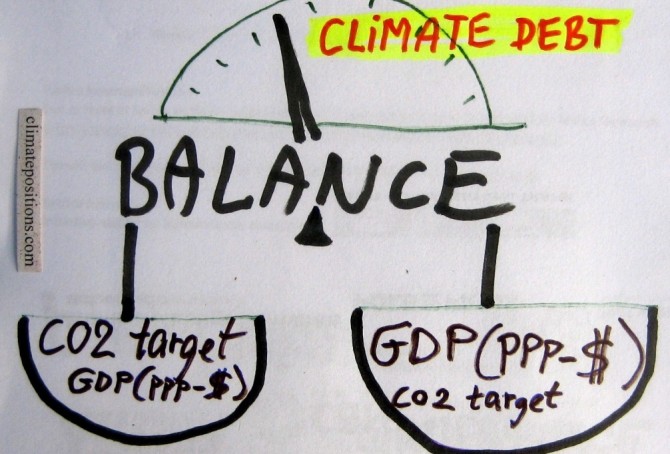
Analyses of the global CO2 target and GDP(ppp-$)
2015
The calculation of Climate Debt in ClimatePositions is based on a balance between many ‘indicators’ and a common global per capita CO2 target. To illustrate the nature of this balance twelve countries are analyzed in this article in terms of the indicator of GDP(ppp-$) and the global CO2 target. The 12-Countries Group represents 38% of the global population, 65% of the global CO2 Emissions from fossil fuels and around 70% of the global Climate Debt.
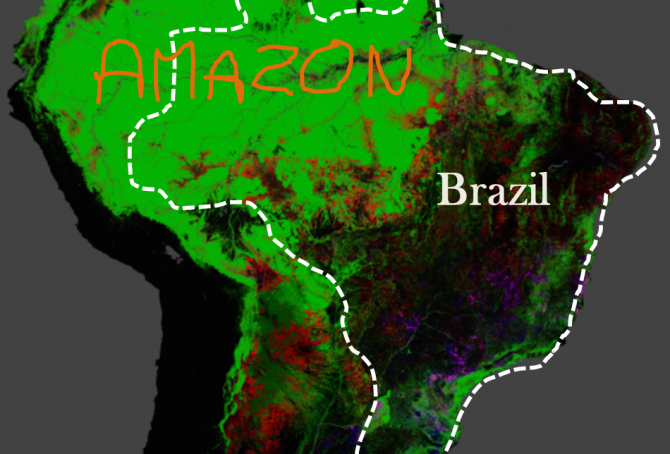
Brazil’s rainforests and climate change performance
2014
The Google map of the Amazon is from the new interactive ‘Global Forest Change‘ developed by The University of Maryland (read ‘more’). The red is Forest Loss from 2000 to 2012, the blue is Forest Gain and the green is Forest Extent (unchanged). The purple is areas of mixed Forest Loss and Forest Gain. According to Brazil’s environment minister the lowest recorded deforestation of Brazil since 1988, was in 2012. Furthermore, up to a third of the cleared rainforest over the past decades may be on the way back (regrowth).
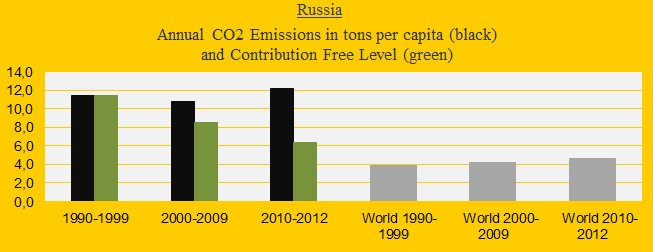
Climate change performance of Russia (compared to other BRICS countries)
2014
Russia was the 4th largest carbon dioxide emitter in 2012 with 5.6% of the global emissions, after China (26.9%), the United States (16.6%) and India (5.8%). The first diagram shows Russia’s CO2 Emissions per capita in decades in comparison with the world average (the green bars are the Contribution Free Level). After the COP summit in 2009 (at which China and the United States rejected a globally binding reduction agreement) the Russian emissions have increased dramatically and today the Russian Climate Contribution (climate debt) is $1,410 per capita (ranked 28th), compared to $627 in 2010 (ranked 32nd). See the ‘ranking’. The following analyzes the development in Putin’s Russia since 2000 in comparison with the other ‘BRICS‘ countries China, India, Brazil and South Africa – jointly emitting 41% of global carbon dioxide in 2012.
New ranking 2014 – update of 147 countries’ climate debt
2014
The data in ClimatePositions are updated consecutively and since the data year 2010 the eleven ‘indicators’ have all been updated.
The new rankings of 147 countries are now available in the menu “Contributions” (with six categories).
All country data and diagrams are available in the menu ‘Calculations (Excel)’. In the coming months selected countries will be analyzed in articles. The following illustrates the latest updates in two ways: 1) The change of climate debt as a percentage of the global climate debt of the twelve largest CO2 emitters, and 2) The key-figures of the United Kingdom.
Forest Cover, Primary Forests and climate debt
2014
The national data of Forest Cover and Primary Forest are both included in the calculations of Climate Contributions (debt) in ClimatePositions. Primary Forest was included as an indicator in the worksheet in August 2014. The following describes selected findings on forests from FAO’s ‘The Global Forest Resources Assessments (FRA), 2010’ (main report, pdf, 378 pages). The Assessment is based on two primary sources of data: 1) ‘country reports’ and 2) remote sensing conducted by FAO and partners.

Update of GDP(ppp-$) 2013
2014
The Climate Contributions (climate debt) in ClimatePositions increases with growing GDP(ppp-$)¹. The 2013 updates and adjustments back in time have now been released (see the ‘World Bank’). For some countries, this means large growth of GDP(ppp-$) since 2000 and thus large increases in Climate Contributions. In other words, the previous data tended to be too modest with respect to the wealth of many countries, in particular Iraq, Jordan, Indonesia, Kazakhstan and Egypt, and the rich authoritarian oil regimes Kuwait, Oman, Saudi Arabia and Qatar. The updated Climate Contributions per capita worldwide are available ‘here’ and in the spreadsheet in the menu ‘Calculations‘. See the Climate Contributions as a percentage of the annual GDP(ppp-$) ‘here‘.
CO2 Emissions from flights
2014
Since the early 1990s the passenger-kilometers of flights worldwide has increased by 5-6% per year. The CO2 Emissions (carbon dioxide) per passenger kilometer vary due to difference in flight distances¹, aircrafts and load factors (percent of occupied seats) – with average load factors First Class and Business Class are causing nine- and three-times higher emissions per passenger than Economy Class, as one study suggests². Furthermore the mixed exhaust from flights causes 2-4 times more global warming than only CO2 emitted from engines on the ground³. The accumulated climate-effect from flights might be as high as 7-9% of the total effect from anthropogenic greenhouse gases4. However, the following examines only the CO2 Emissions from flights and the implied national costs in Climate Contributions (climate debt). But first see these three seductive animations (from ‘nats‘) with 24-hours flights over ‘Europe 1:59‘, ‘Middle East 1:11‘ and ‘North Atlantic 1:52‘.