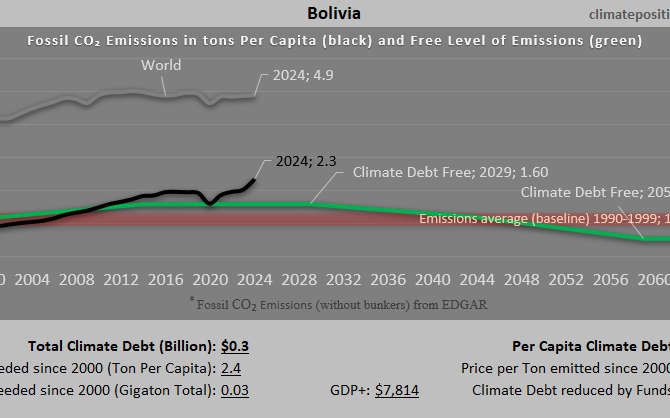
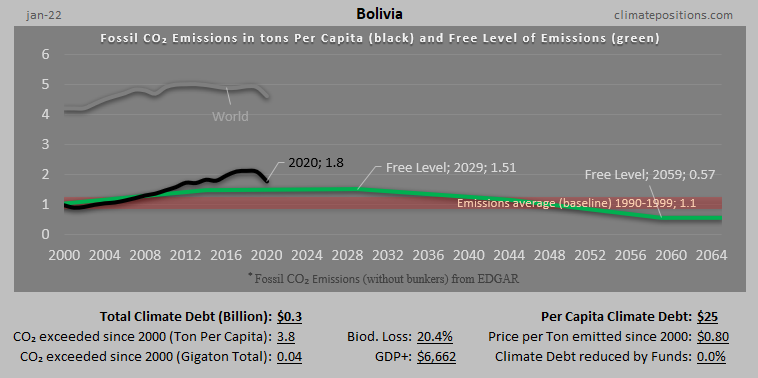
Climate Debt of Bolivia 2025: $260 Million or 0.003% of the Global Climate Debt (or $21 Per Capita)
/2025/ Bolivia ranks 94th in Climate Debt Per Capita accumulated 2000-2025. Below are some key figures in the calculations. The diagram above shows the Fossil CO2 Emissions Per Capita and the Free Level of emissions (green). The wide straight red line shows emissions in the 1990s (baseline in the calculations).
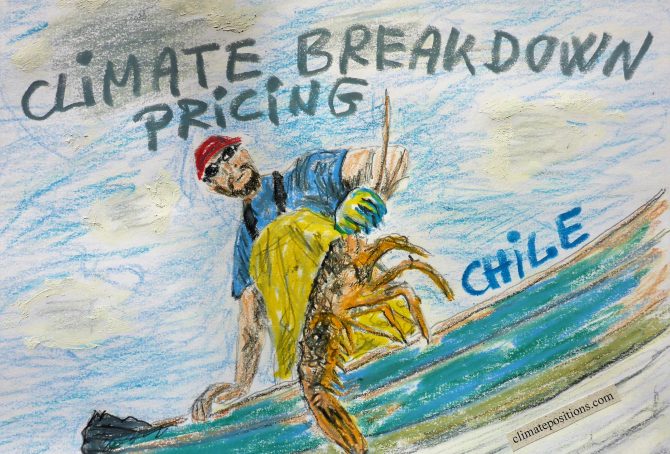
Chile – per capita Fossil CO2 Emissions and Climate Debt
2020
Chile’s current Climate Breakdown Pricing amounts to $11.78 per tons Fossil CO2 emitted since 2000. The Climate Debt grew from $437 per capita in 2015 to $934 in 2020. Updated Rankings of 165 countries are available in the menu “Climate Debt”.
The following diagrams expose the trends of Fossil CO2 Emissions, Climate Debt, GDP(ppp-$), Forest Cover, Primary Forest and Ecological Footprint without carbon.
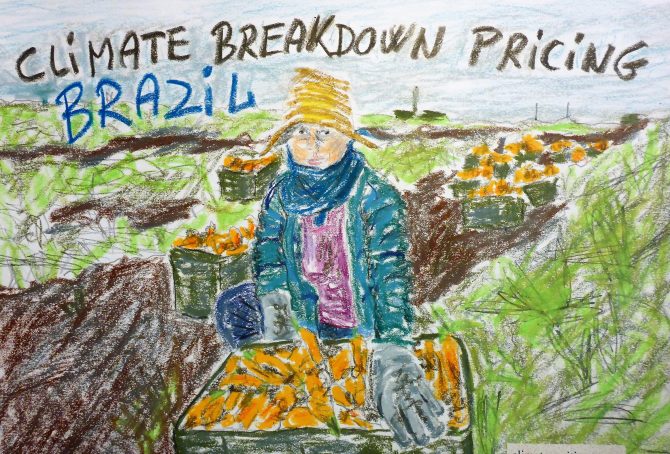
Brazil – per capita Fossil CO2 Emissions and Climate Debt
2020
Brazil’s current Climate Breakdown Pricing amounts to $5.74 per tons Fossil CO2 emitted since 2000. The Climate Debt grew from $108 per capita in 2015 to $246 in 2020. Updated Rankings of 165 countries are available in the menu “Climate Debt”.
The following diagrams expose the trends of Fossil CO2 Emissions, Climate Debt, GDP(ppp-$), Ecological Footprint without carbon, Forest Cover and Primary Forest.
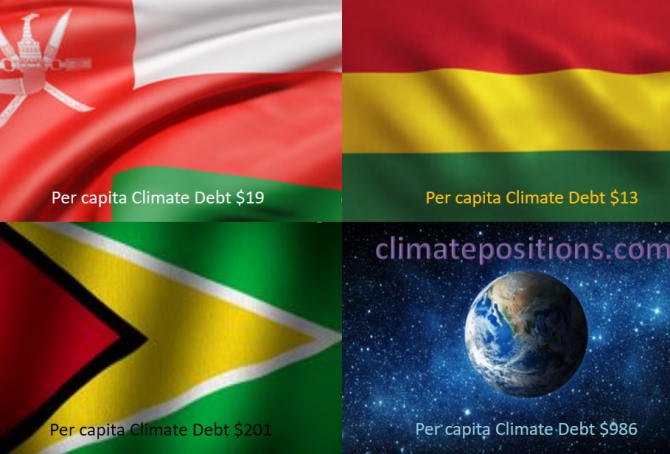
Share of global Climate Debt rank 85th, 86th, and 87th: Honduras, Guyana and Bolivia (combined responsible for 0.006% of Climate Debt and 0.090% of Fossil CO2 Emissions 2016)
2018
The diagram below shows ‘Share of global Climate Debt‘ in 2010, 2015 and 2017 of Honduras, Guyana and Bolivia (ranked 85th, 86th, and 87th). The share of Honduras decreased significantly during the period. The global Climate Debt accumulated since 2000 is $7.2 Trillion.
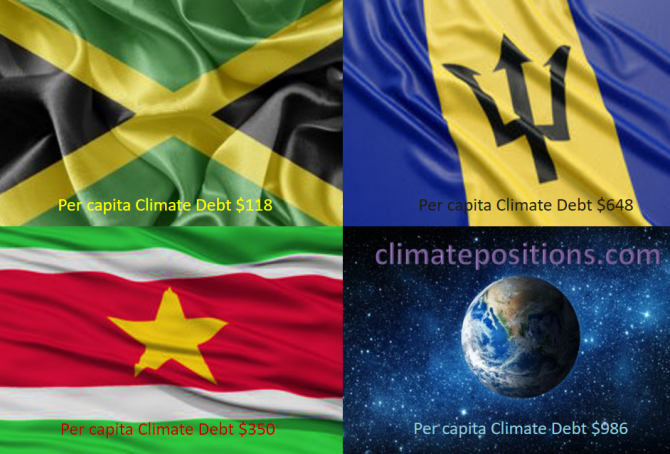
Share of global Climate Debt rank 82nd, 83rd, and 84st: Jamaica, Suriname and Barbados (combined responsible for 0.01% of Climate Debt and 0.04% of Fossil CO2 Emissions 2016)
2018
The diagram below shows ‘Share of global Climate Debt‘ in 2010, 2015 and 2017 of Jamaica, Suriname and Barbados (ranked 82nd, 83rd, and 84st). The accumulated global Climate Debt is $7.2 Trillion.
India’s Climate Debt is on track for something big
2016
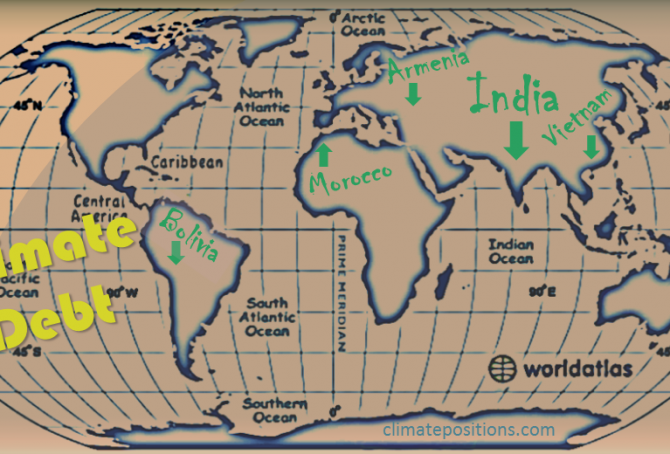
India’s accumulated Climate Debt is $13 per capita which ranks the populous country 84th among 148 countries (see the ‘Ranking’). The current share of the fast growing global Climate Debt is 0.29%, compared to 0.04% in 2010. The following examines India’s CO2 Emissions (the increase-rates is compared to the historic Chinese rates), Environmental Performance, GDP(ppp-$) and Climate Debt in comparison with Vietnam, Morocco, Armenia and Bolivia, all ranked between 77th and 82nd.
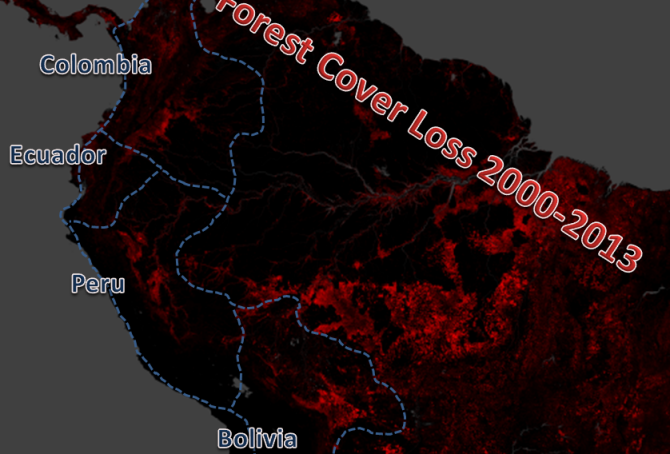
Climate change performance of Ecuador, Bolivia, Colombia and Peru
2015
1.4% of the global population lives in Ecuador, Bolivia, Colombia or Peru, and together they emitted 0.6% of the global CO2 from fossil fuels in 2012. Ecuador’s updated Climate Debt per capita is $84 and Bolivia’s is $18. Colombia and Peru are both Contribution Free. See the ‘ranking’ by November 2014. The following examines the indicators of CO2 Emissions (carbon dioxide from fossil fuels), Forests and GDP(ppp-$).
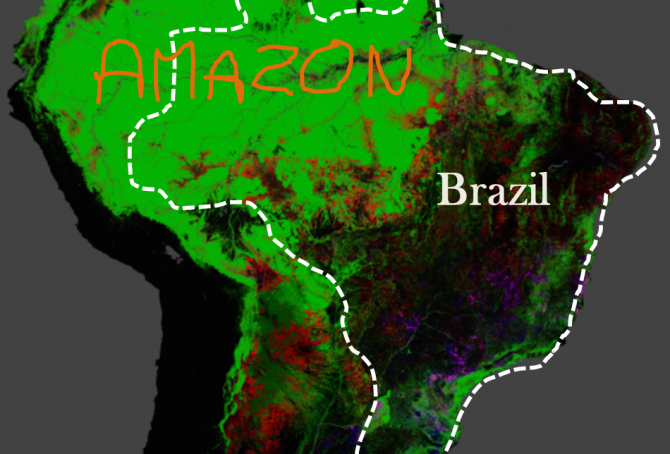
Brazil’s rainforests and climate change performance
2014
The Google map of the Amazon is from the new interactive ‘Global Forest Change‘ developed by The University of Maryland (read ‘more’). The red is Forest Loss from 2000 to 2012, the blue is Forest Gain and the green is Forest Extent (unchanged). The purple is areas of mixed Forest Loss and Forest Gain. According to Brazil’s environment minister the lowest recorded deforestation of Brazil since 1988, was in 2012. Furthermore, up to a third of the cleared rainforest over the past decades may be on the way back (regrowth).

Invasive species, climate change and mass extinction
2014
There is a lack of standard terminology for invasive species. Some used definitions¹ seem artificially twisted so that Homo sapiens can’t be classified as an invasive species (which of cause is absurd since we are the worst). My own definition used in this article is this: “Invasive species are animals and plants introduced into places out of their natural range of distribution, where they have a tendency to spread and generate a negative impact on the local ecosystem and species.” This clarifies three disputes: a) A species can be invasive and not invasive at different times and different places, b) consequently, not all Homo sapiens are necessarily invasive, and certainly not all the time and c) transportation by plane, ship, train, vehicle, etc. often carry animals (including Homo sapiens) and plants further than their natural range of distribution. This opens up for analyzes.
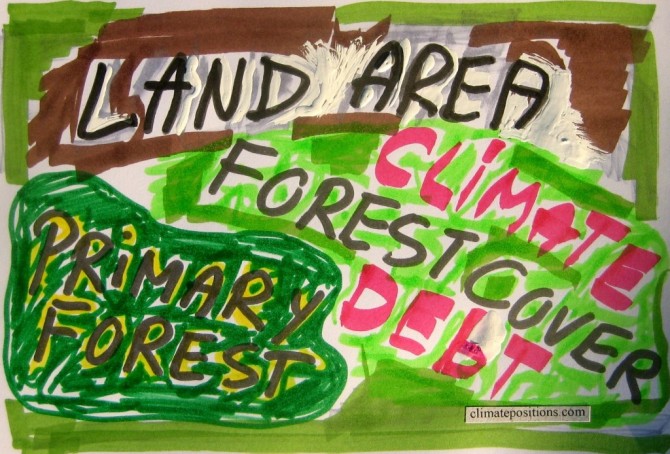
Forest Cover, Primary Forests and climate debt
2014
The national data of Forest Cover and Primary Forest are both included in the calculations of Climate Contributions (debt) in ClimatePositions. Primary Forest was included as an indicator in the worksheet in August 2014. The following describes selected findings on forests from FAO’s ‘The Global Forest Resources Assessments (FRA), 2010’ (main report, pdf, 378 pages). The Assessment is based on two primary sources of data: 1) ‘country reports’ and 2) remote sensing conducted by FAO and partners.