Romania – per capita Fossil CO2 Emissions and Climate Debt
2020
Romania’s current Climate Breakdown Pricing amounts to $2.78 per tons Fossil CO2 emitted since 2000. The Climate Debt grew from $65 per capita in 2015 to $235 in 2020. Updated Rankings of 165 countries are available in the menu “Climate Debt”.
The following diagrams expose the trends of Fossil CO2 Emissions, Climate Debt, GDP(ppp-$), Population Growth and Ecological Footprint without carbon.
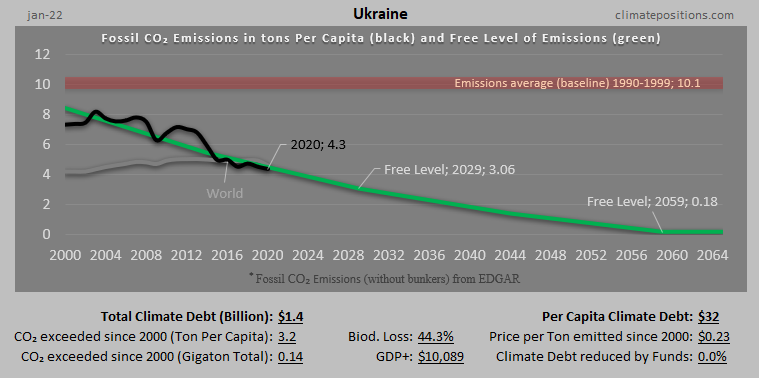
Ukraine – per capita Fossil CO2 Emissions and Climate Debt
2020
Ukraine’s current Climate Breakdown Pricing amounts to $0.82 per tons Fossil CO2 emitted since 2000. The Climate Debt grew from $44 per capita in 2015 to $105 in 2020. Updated Rankings of 165 countries are available in the menu “Climate Debt”.
The following diagrams expose the trends of Fossil CO2 Emissions, Climate Debt, GDP(ppp-$), Nuclear Power and Ecological Footprint without carbon.
Poland – per capita Fossil CO2 Emissions and Climate Debt
2020
Poland’s current Climate Breakdown Pricing amounts to $9.87 per tons Fossil CO2 emitted since 2000. The Climate Debt grew from $593 per capita in 2015 to $1,555 in 2020. Updated Rankings of 165 countries are available in the menu “Climate Debt”.
The following diagrams expose the trends of Fossil CO2 Emissions, Climate Debt, GDP(ppp-$) and Ecological Footprint without carbon.
Russia – per capita Fossil CO2 Emissions and Climate Debt
2020
Russia’s current Climate Breakdown Pricing amounts to $12.16 per tons Fossil CO2 emitted since 2000. The Climate Debt grew from $1,346 per capita in 2015 to $2,676 in 2020. Updated Rankings of 165 countries are available in the menu “Climate Debt”.
The following diagrams expose the trends of Fossil CO2 Emissions, Climate Debt, GDP(ppp-$) and Ecological Footprint without carbon.
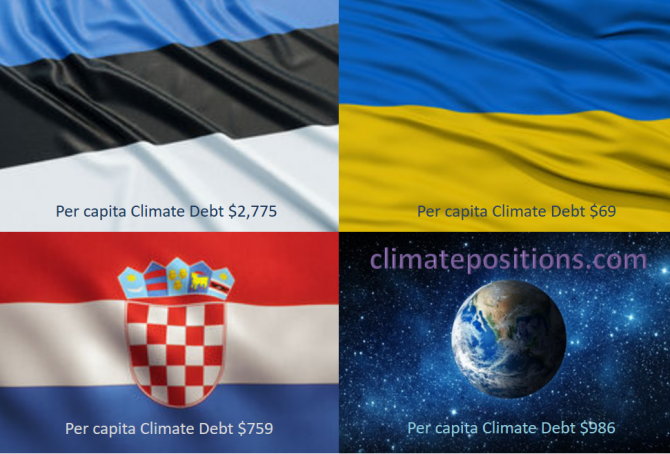
Share of global Climate Debt rank 61st, 62nd and 63rd: Estonia, Croatia and Ukraine (combined responsible for 0.14% of Climate Debt and 0.77% of Fossil CO2 Emissions 2016)
2018
The diagram below shows ‘Share of global Climate Debt‘ in 2010, 2015 and 2017 of Estonia, Croatia and Ukraine (ranked 61st, 62nd and 63rd). The shares of Estonia and Ukraine are increasing, whereas the share of Croatia is decreasing.
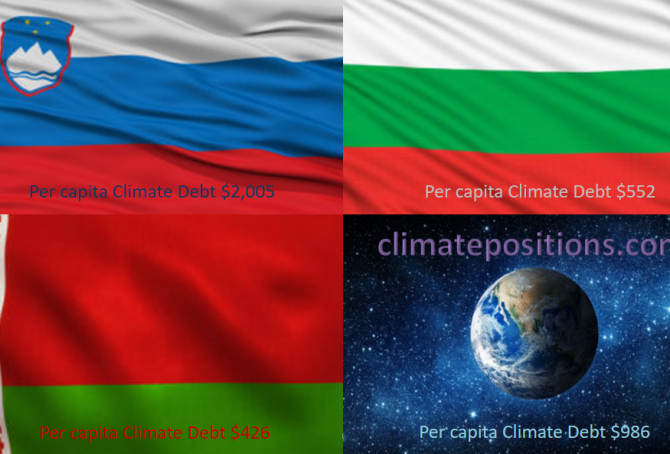
Share of global Climate Debt rank 58th, 59th and 60th: Slovenia, Belarus and Bulgaria (combined responsible for 0.17% of Climate Debt and 0.36% of Fossil CO2 Emissions 2016)
2018
The diagram below shows ‘Share of global Climate Debt‘ in 2010, 2015 and 2017 of Slovenia, Belarus and Bulgaria (ranked 58th, 59th and 60th). The share of Slovenia is decreasing, whereas the shares of Belarus and Bulgaria are increasing rather fast (Belarus had no Climate Debt in 2010).
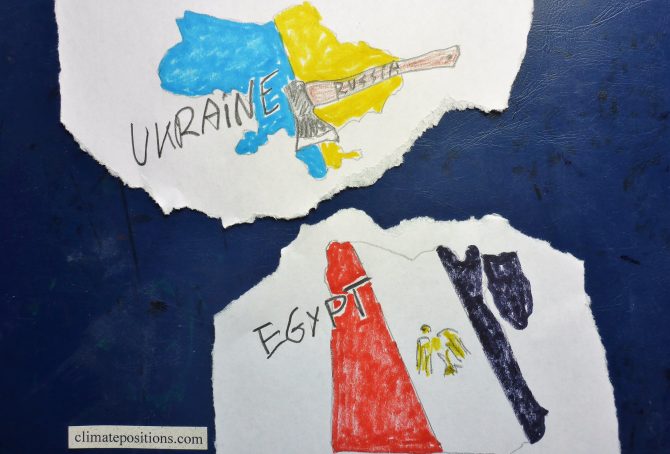
Climate change performance: Egypt vs. Ukraine
Egypt and Ukraine are the world’s 25th and 26th largest emitters of CO2 from Fossil Fuels and cement. Combined, the two countries were responsible for 1.2% of global CO2 Emissions in 2015. The following examines the ‘Indicators‘ of CO2 Emissions, GDP(ppp-$), Ecological Footprint and the Ukrainian Nuclear Power.
The diagrams below show the per capita CO2 Emissions from Fossil Fuel (without bunkers) and cement, since 2000. The green bars show the Free Emission Level¹ – the exceedance is the basis for calculating the national Climate Debt.

Climate Debt: Australia ranks 8th (performance of the twenty largest coal producers)
2016
Australia covers around 5.7% of planet’s land area and populates 0.3% of its people. The Climate Debt of the 24 million Australian’s amounts to $132 billion, or $5,613 per capita, which ‘Ranks’ Australia 8th among 148 countries – in 2010 the ranking was 6th. Australia is the world’s 5th largest coal producer and the 2nd largest per capita CO2 emitter from coal combustion … and coal is the most efficient climate destroyer. The table below reveals some key figures of the world’s twenty largest coal producers. Subsequently, Australia’s climate change performance is examined in comparison with four other top-five countries on CO2 Emissions from coal combustion (per capita): Kazakhstan (ranked 1), South Africa (3), the United States (4) and Poland (5).
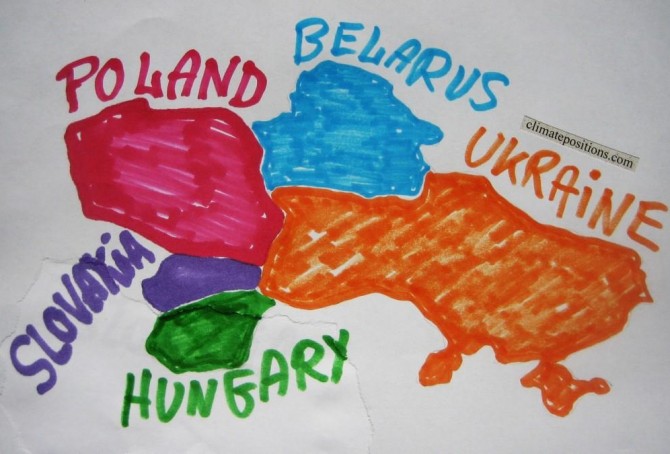
Climate change performance of Slovakia, Poland, Hungary, Belarus and Ukraine
2015
1.5% of the global population lives in Slovakia, Poland, Hungary, Belarus or Ukraine and together they emitted 2.3% of the global CO2 from fossil fuels in 2012 – the joint share of the global Climate Debt was 0.7%.
Slovakia’s accumulated Climate Debt per capita is now $640 (in 2014 the ranking was 43rd among 147 countries), Poland’s is $519 (ranked 47th), Hungary’s is $406 (ranked 54th), Belarus’ is $274 (ranked 59th) and Ukraine’s is $168 (ranked 63rd). See the ‘ranking’. The following examines the Climate Debt trends and the indicators of CO2 Emissions from fossil fuels, GDP(ppp-$) and Climate Debt as a percentage of GDP.
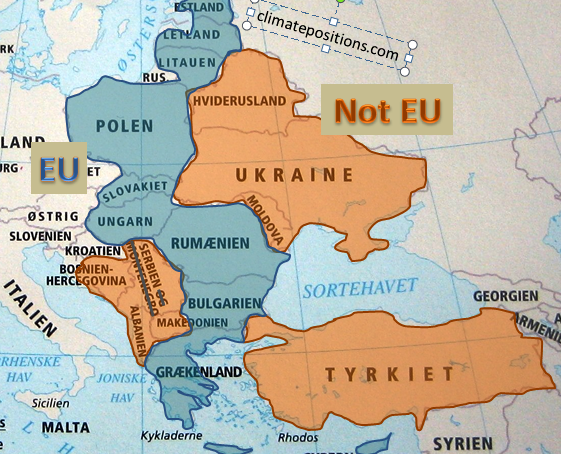
European Union “east” compared to bordering countries
2015
The ‘European Union’ (EU) is an economic and political partnership between ‘28 countries’. Around 7% of the global population lives in EU and they emit around 12% of the global CO2 from fossil fuels and are responsible of 13% of the Climate Debt in ClimatePositions. The following examines a group of 10 countries in eastern EU which joined the union between 1981 and 2007 in comparison with 8 bordering countries.