2025: New Climate Debt calculations and Rankings (168 countries with full data)
/2025/ Updated Climate Debt calculations and Rankings are available in the main menus above. The indicators of Biodiversity Loss and Nuclear Power are no longer included in the calculations.
2024: Ranking updates now available (Global Climate Debt increases by 1.4 trillion dollars in two years)
/2024/ A new version of ClimatePositions Calculation Excel is now available in the menu. Updated rankings by country are also available in the menus.
In January 2024, the Global Climate Debt (accumulated since 2000) was 7.8 Trillion dollars, which is an increase of 700 Billion dollars annually since 2022. This reflects the tragic fact that global CO2 Emissions from Fossil Fuels were 6.7% higher in 2022 than in 2020.
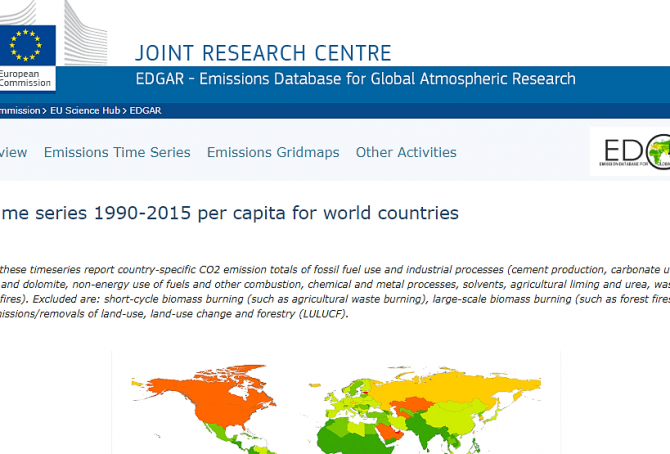
ClimatePositions has been updated with Fossil CO2 Emissions data from EDGAR
2017
As announced in the previous ‘Article‘ the calculations of Climate Debt by country in ClimatePositions has now been updated with CO2 Emissions data from ‘EDGAR‘ (European Commission), instead of data from Global Carbon Project (CDIAC).
At the same time, the global CO2 target has been raised by 0.2 tons per capita by 2025, and the indicators of Ecological Footprint (without carbon) and GDP (ppp-$) 2016 have been updated as well. New updated rankings are available in the menu “Climate Debt” above. Updated data and diagrams with all ‘Indicators‘ and all countries are available in the submenu ‘Calculations (Excel)‘.
The table below shows the new ranking of 163 countries in comparison with the previous (last) ranking (159 countries) with emission data from Global Carbon Project (CDIAC). No Climate Debt is marked “free”. Only Montenegro is excluded from the new ranking due to missing CO2 Emission data (ranks 69th in the previous ranking).

Global Carbon Project (CDIAC), located in the United States, stops publishing carbon emissions data by country – will be replaced by EDGAR in ClimatePositions
2017
The Carbon Dioxide Information Analysis Center (CDIAC), located at the U.S. Department of Energy’s (DOE) Oak Ridge National Laboratory, has published annual Carbon Emissions from Fossil Fuels and cement production by country since 1959 (‘Global Carbon Project‘), but now this continuous time series has come to an end and 2015 will be the last data-year (as it seems).
Since carbon emissions data from CDIAC (Global Carbon Project) is the core ‘Indicator‘ in ClimatePositions’ calculation of Climate Debt, carbon emissions data will be replaced with nearly similar data from ‘EDGAR‘ (‘European Commission‘ / ‘Climate Action‘), retroactively since 1990, in connection with the coming updates [done 16-08-2017].
The following describes the differences between CO2 Emissions data from Global Carbon Project (CDIAC) and EDGAR (sourced: European Commission, Joint Research Centre (JRC)/Netherlands Environmental Assessment Agency (PBL). Emission Database for Global Atmospheric Research (EDGAR)), and the consequences in terms of Climate Debt in ClimatePositions – illustrated with a range of country examples. Note that other sources, such as ‘IEA‘, ‘EIA‘ and ‘BP‘, provides CO2 Emissions data-sets different from the ones of CDIAC and EDGAR.
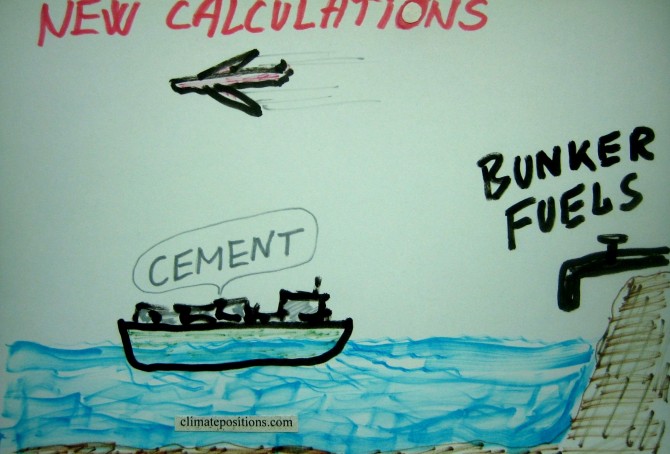
ClimatePositions: CO2 Emission-data now include cement production (and exclude bunker fuels)
So far, ‘EIA’ has been the source of national CO2 Emissions in ClimatePositions. EIA include emissions from burning of fossil fuel, including bunker fuels (fuels used for international aviation and maritime transport). Globally, bunker fuels account for about 3% of all fossil fuel CO2 Emissions.
By January 2016, the source of CO2 Emissions used in ClimatePositions switches to ‘Carbon Dioxide Information Analysis Center (CDIAC)’, or simply Global Carbon Project. CDIAC also include emissions from burning of fossil fuel, but exclude emissions from bunker fuels (fuels used for international aviation and maritime transport), and instead include ‘CO2 Emissions from cement production’. Emissions from cement production (and oxidation) amount to about 5% of all fossil fuel emissions, globally. The total annual national carbon emissions at the source are subsequently converted¹ to per capita CO2 Emissions for the use in ClimatePositions. Note that emissions 2012-2014 are preliminary estimates².
For comparison, the table below shows the national shares of the global Climate Debt, respectively, with CO2 Emission data from 1) Global Carbon Project (CDIAC) and 2) EIA. Countries with increased Climate Debt, relatively, due to the conversion of sources are marked in red. The global Climate Debt will only be slightly affected by the change (the global Climate Debt is 5.7 trillion by Januar 2016).
From today, Global Carbon Project will be used as source of CO2 Emissions in ClimatePositions. New rankings are available in the menu “Climate Debt”. More comments below the table.
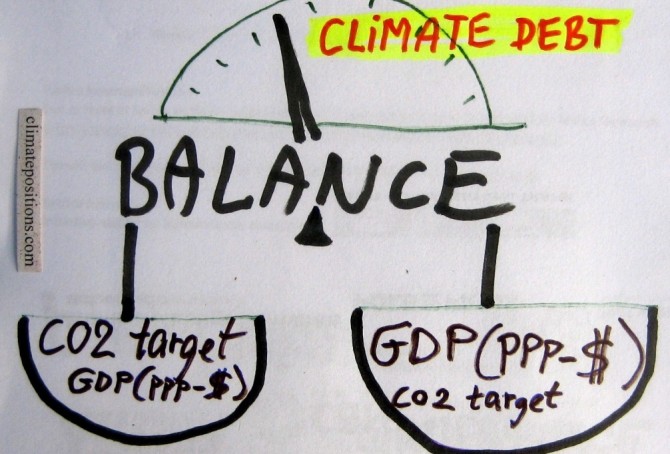
Analyses of the global CO2 target and GDP(ppp-$)
2015
The calculation of Climate Debt in ClimatePositions is based on a balance between many ‘indicators’ and a common global per capita CO2 target. To illustrate the nature of this balance twelve countries are analyzed in this article in terms of the indicator of GDP(ppp-$) and the global CO2 target. The 12-Countries Group represents 38% of the global population, 65% of the global CO2 Emissions from fossil fuels and around 70% of the global Climate Debt.

Update: Climate funding as share of Climate Debt, by country
2015
‘Climate Funds Update’ is an independent website providing information on climate finance designed for developing countries to address climate change. The data is based on information received from 25 multilateral, bilateral, regional and national climate funds and the funding is largely up to date by the end of June 2015. A total of $17 billion has currently been funded (money deposited), of which 96% is country-sourced¹. The updated table below shows the level of national climate financing to developing countries, as percentage of the accumulated Climate Debt. The values are based on the latest available updates.
CO2 reduction targets worldwide
2014
Countless proposals have been launched during the years for the required reductions in CO2 Emissions. However, most of the suggested reduction targets have been empty statements and the overall scientific recommendations¹ are persistently being ignored by those in power. Meanwhile the global CO2 Emissions continue to increase (by 52% since 1990) and the worst case climate scenario is now unfolding.

Questions and answers (6-9)
2013
Question 6: What can you do as a consumer?
Reductions in your consumption of fossil fuels, meat and unneeded items will contribute to limit climate change and ecological decline. Furthermore, you can buy organic (ecological) products if possible. Finally, you can prioritize products from Contribution Free countries and tend to choose products from the better performing countries in ClimatePositions (see the menu “Contributions/Per Capita US$ Rank”). Other important factors than ranking can of course influence your spending choices. Are you poor you can do very little or nothing.

Questions and answers (1-5)
2013
Question 1: Are the contributions in ClimatePositions a valuation of the losses of the planet’s natural heritage?
No, the planet’s nature (biodiversity) is miraculous and priceless. ClimatePositions is a proposal to a fair financial breakdown of the unavoidable additional expenses towards sustainability and climate change actions. The level of Contributions worldwide can be changed with a single entry in the spreadsheet.

54 countries with incomplete data
2013
199 countries are included in ClimatePositions (Excel) but 54 countries have incomplete data (0.5% of the Global Population). The front image shows the 20 largest CO2 Emitters (carbon dioxide) per capita in 2011 among the 54 countries. Without full data it is not possible to calculate the national Climate Contribution (climate debt). See the country list below with the missing data mentioned in brackets. Notes that the national Contributions can be estimated by using indicator assumptions – see an example with Bahrain in the bottom.
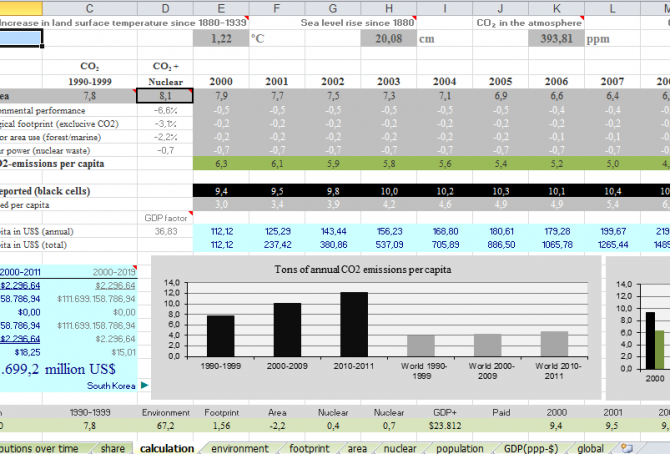
About calculation of national climate contributions
2013
The calculations in ClimatePositions are complex and yet the same for all countries. The progressive national indicator updates since 2000 ensure that the countries multifaceted performances are reflected directly in the Climate Contributions (climate debt). The front image shows the main calculation spreadsheet (Excel) in ClimatePositions. All updated indicator values are entered the spreadsheet and by copying a country from the country list (with all the numerical values) and insert in the country box (cell A30) – all calculations are done automatically and the national Contribution per capita appears (cell B20).
About this website
2013
The resources behind climatepositions.com are independent of economic, political and national interests. The website’s aim is to identify national climate change positions worldwide and thus expose incompetence, hypocrisy and cynicism – and uplifting achievements.