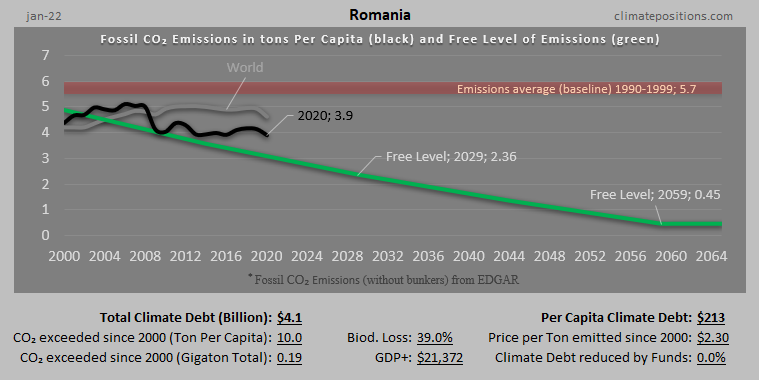
Romania – per capita Fossil CO2 Emissions and Climate Debt
2020
Romania’s current Climate Breakdown Pricing amounts to $2.78 per tons Fossil CO2 emitted since 2000. The Climate Debt grew from $65 per capita in 2015 to $235 in 2020. Updated Rankings of 165 countries are available in the menu “Climate Debt”.
The following diagrams expose the trends of Fossil CO2 Emissions, Climate Debt, GDP(ppp-$), Population Growth and Ecological Footprint without carbon.
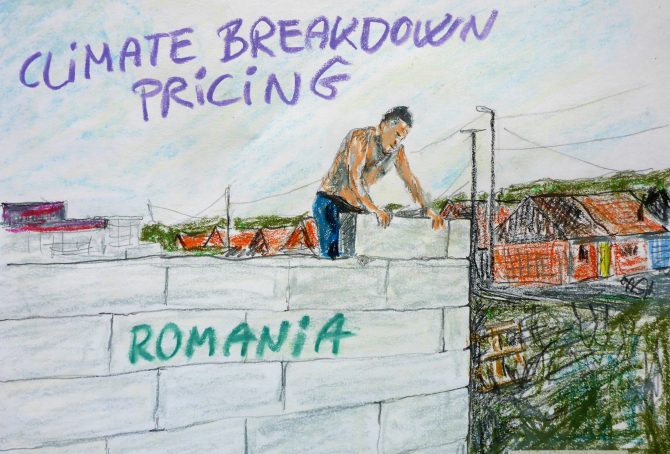
Ukraine – per capita Fossil CO2 Emissions and Climate Debt
2020
Ukraine’s current Climate Breakdown Pricing amounts to $0.82 per tons Fossil CO2 emitted since 2000. The Climate Debt grew from $44 per capita in 2015 to $105 in 2020. Updated Rankings of 165 countries are available in the menu “Climate Debt”.
The following diagrams expose the trends of Fossil CO2 Emissions, Climate Debt, GDP(ppp-$), Nuclear Power and Ecological Footprint without carbon.
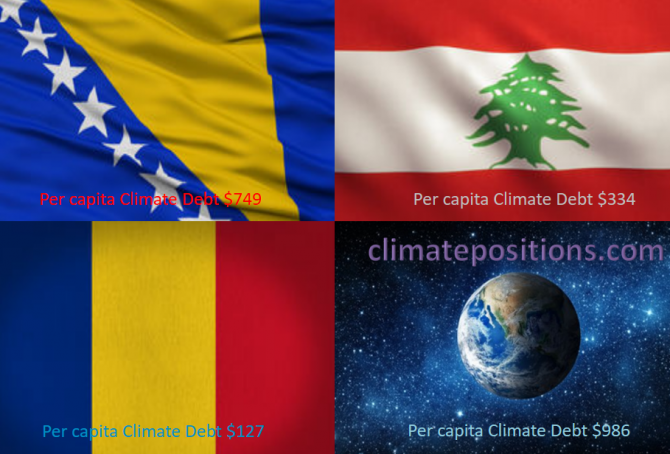
Share of global Climate Debt rank 64th, 65th and 66th: Bosnia and Herzegovina, Romania and Lebanon (combined responsible for 0.10% of Climate Debt and 0.35% of Fossil CO2 Emissions 2016)
2018
The diagram below shows ‘Share of global Climate Debt‘ in 2010, 2015 and 2017 of Bosnia and Herzegovina, Romania and Lebanon (ranked 64th, 65th and 66th). The shares of Romania and Lebanon are ups and downs, while the share of Bosnia and Herzegovina is steadier.
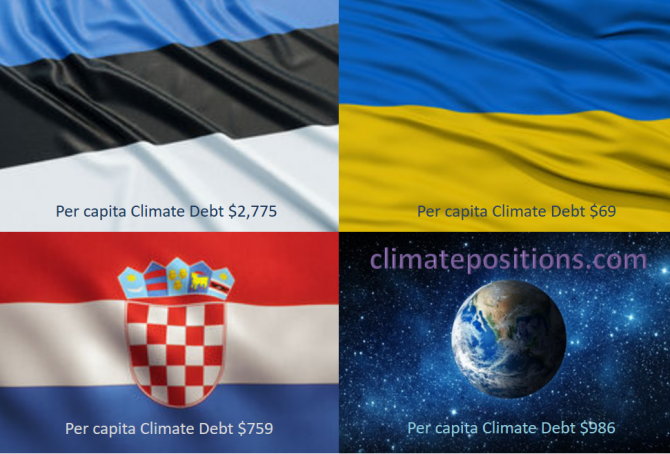
Share of global Climate Debt rank 61st, 62nd and 63rd: Estonia, Croatia and Ukraine (combined responsible for 0.14% of Climate Debt and 0.77% of Fossil CO2 Emissions 2016)
2018
The diagram below shows ‘Share of global Climate Debt‘ in 2010, 2015 and 2017 of Estonia, Croatia and Ukraine (ranked 61st, 62nd and 63rd). The shares of Estonia and Ukraine are increasing, whereas the share of Croatia is decreasing.
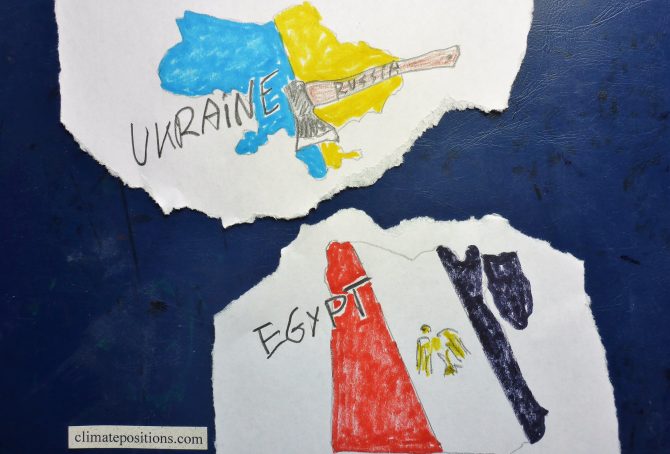
Climate change performance: Egypt vs. Ukraine
Egypt and Ukraine are the world’s 25th and 26th largest emitters of CO2 from Fossil Fuels and cement. Combined, the two countries were responsible for 1.2% of global CO2 Emissions in 2015. The following examines the ‘Indicators‘ of CO2 Emissions, GDP(ppp-$), Ecological Footprint and the Ukrainian Nuclear Power.
The diagrams below show the per capita CO2 Emissions from Fossil Fuel (without bunkers) and cement, since 2000. The green bars show the Free Emission Level¹ – the exceedance is the basis for calculating the national Climate Debt.
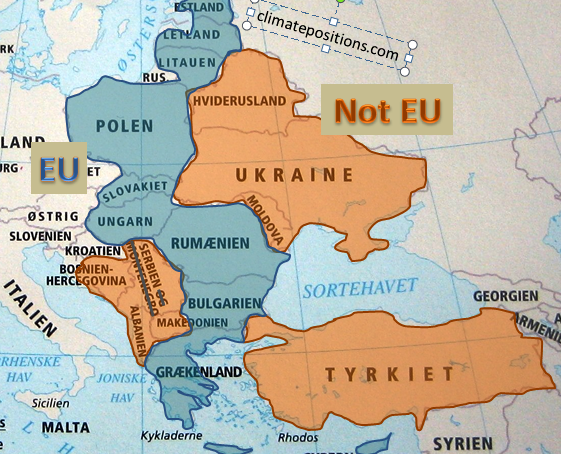
European Union “east” compared to bordering countries
2015
The ‘European Union’ (EU) is an economic and political partnership between ‘28 countries’. Around 7% of the global population lives in EU and they emit around 12% of the global CO2 from fossil fuels and are responsible of 13% of the Climate Debt in ClimatePositions. The following examines a group of 10 countries in eastern EU which joined the union between 1981 and 2007 in comparison with 8 bordering countries.
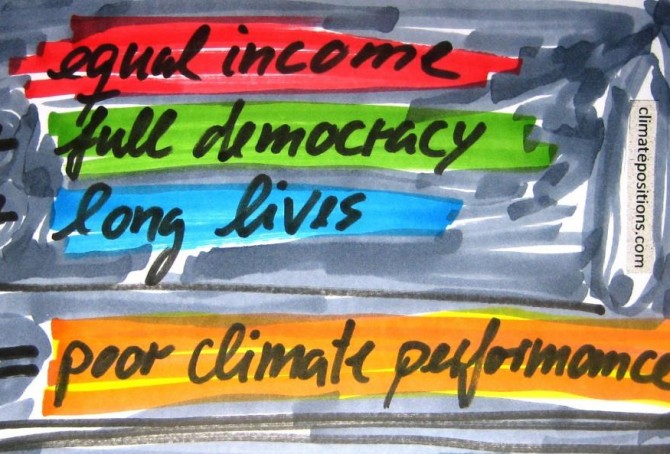
Income Equality, Life Expectancy, Democracy Index … and Climate Contributions
2014
123 out of 145 countries with full data in ClimatePositions are included in an inventory of Income Equality (see the source at the bottom), which shows how much the 10% poorest earns compared to the 10% richest. 53 out of the 123 countries are Contribution Free (no climate debt) in ClimatePositions 2010 and 70 countries are not.
The table below shows the difference between the two groups of countries in terms of Income Equality, Life Expectancy, number of Full Democracies and number of Authoritarian Regimes. To clarify the trend the 20 countries with the largest Climate Contributions appear at the top of the table. The 123 countries represent 95% of the world population.
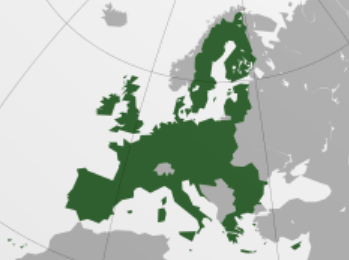
European Union perform poorly
2013
The map (from Wikipedia) shows the very different countries in ‘European Union‘ (EU). As a whole EU perform poorly on the climate challenge and only Romania was Contribution Free in ClimatePositions 2010. Both Netherlands and Belgium are among the top 10 worst performing countries in the world. Se the EU rank at the end and the global ranking in the menu “Contributions/Per Capita US$ Rank”).

Impressive performance by Costa Rica
2013
In 2010 ‘Costa Rica‘ was the only Contribution Free, full democratic country with a GDP(ppp-$) above the global average. The diagram above shows the national CO2 Emissions per capita (the black bars) and the Contribution Free Levels of CO2 Emissions (the green bars) in 2000-2011. Note that Costa Rica could have increased CO2 Emissions (carbon dioxide) from 1.2 ton CO2 per capita in 2000 to 1.9 tons in 2011 and still be Contribution free, due to other fine indicator values.