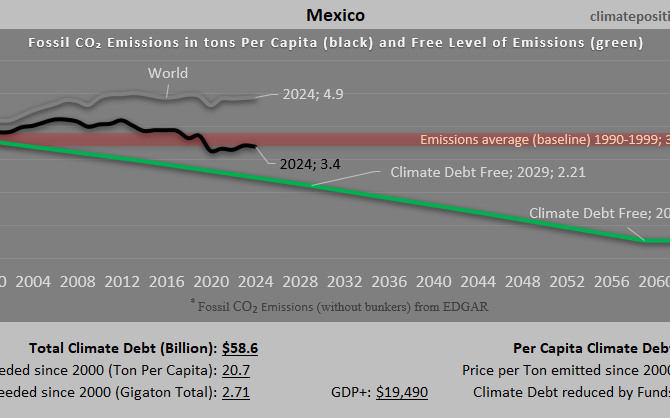
Climate Debt of Mexico 2025: $59 Billion or 0.63% of the Global Climate Debt (or $448 Per Capita)
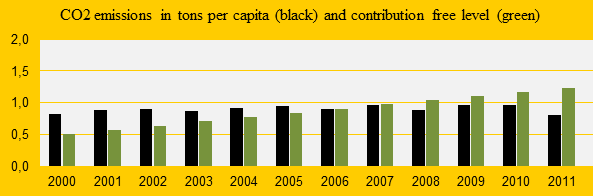
/2025/ Mexico ranks 67th in Climate Debt Per Capita accumulated 2000-2025. Below are some key figures in the calculations. The diagram above shows the Fossil CO2 Emissions Per Capita and the Free Level of emissions (green). The wide straight red line shows emissions in the 1990s (baseline in the calculations).

Venezuela – per capita Fossil CO2 Emissions and Climate Debt (economic collapse)
2020
Venezuela’s current Climate Breakdown Pricing amounts to $10.04 per tons Fossil CO2 emitted since 2000. The Climate Debt grew from $655 per capita in 2015 to $1,045 in 2020. However, once updated data on national GDP(ppp-$) is released, then the current Climate Debt will prove to be considerably smaller (more below). Updated Rankings of 165 countries are available in the menu “Climate Debt”.
The following diagrams expose the trends of Fossil CO2 Emissions, GDP(ppp-$), Climate Debt, Forest Cover, Primary Forest and Ecological Footprint without carbon.
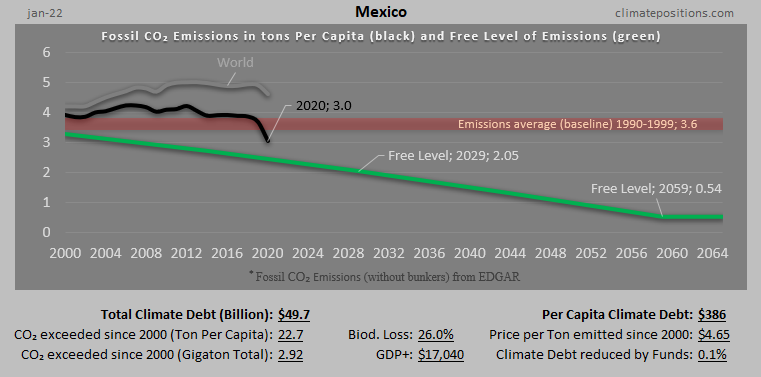
Mexico – per capita Fossil CO2 Emissions and Climate Debt
2020
Mexico’s current Climate Breakdown Pricing amounts to $8.71 per tons Fossil CO2 emitted since 2000. The Climate Debt grew from $291 per capita in 2015 to $662 in 2020. Updated Rankings of 165 countries are available in the menu “Climate Debt”.
The following diagrams expose the trends of Fossil CO2 Emissions, Climate Debt, GDP(ppp-$), Nuclear Power and Ecological Footprint without carbon.

United States – per capita Fossil CO2 Emissions and Climate Debt
2020
The current Climate Breakdown Pricing of the United States amounts to $30.82 per tons Fossil CO2 emitted since 2000. The Climate Debt grew from $5,497 per capita in 2015 to $10,718 in 2020. Updated Rankings of 165 countries are available in the menu “Climate Debt”.
The following diagrams expose the trends of Fossil CO2 Emissions, Climate Debt, GDP(ppp-$) and Nuclear Power.
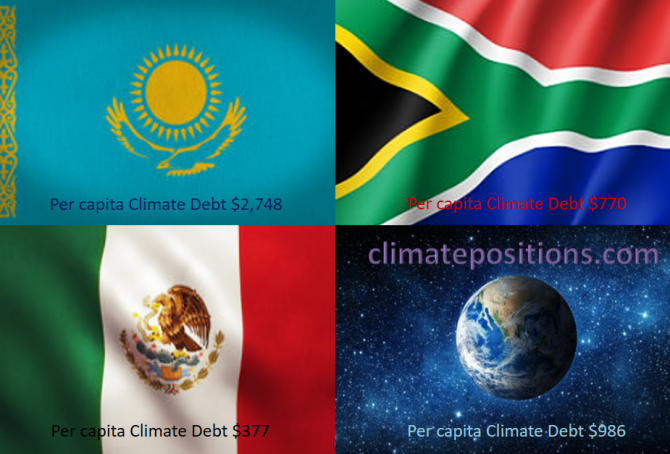
Share of global Climate Debt rank 22nd, 23rd and 24th: Kazakhstan, Mexico and South Africa (combined responsible for 1.9% of Climate Debt and 3.0% of Fossil CO2 Emissions 2016)
2017
The diagram below shows ‘Share of global Climate Debt‘ in 2010, 2015 and 2017 of Kazakhstan, Mexico and South Africa (ranked 22nd, 23rd and 24th). Kazakhstan’s share increased dramatically in a short period of time due to growing Fossil CO2 Emissions.
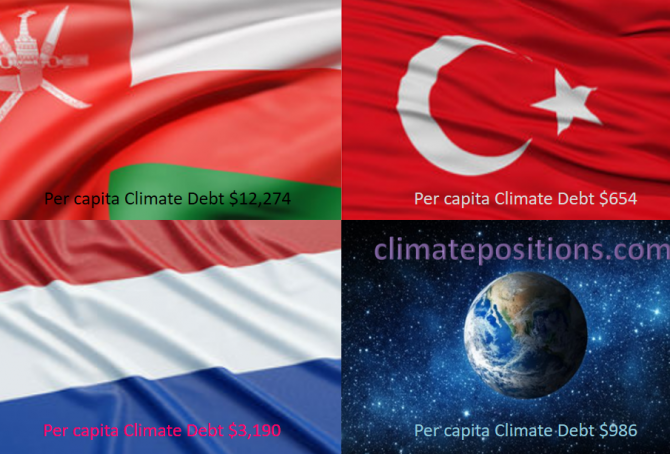
Share of global Climate Debt rank 19th, 20th and 21st: Oman, Netherlands and Turkey (combined responsible for 2.2% of Climate Debt and 1.7% of Fossil CO2 Emissions 2016)
2017
The diagram below shows ‘Share of global Climate Debt‘ in 2010, 2015 and 2017 of Oman, Netherlands and Turkey (ranked 19th, 20th and 21st). The share Netherlands is decreasing steadily, whereas Turkey’s is increasing.
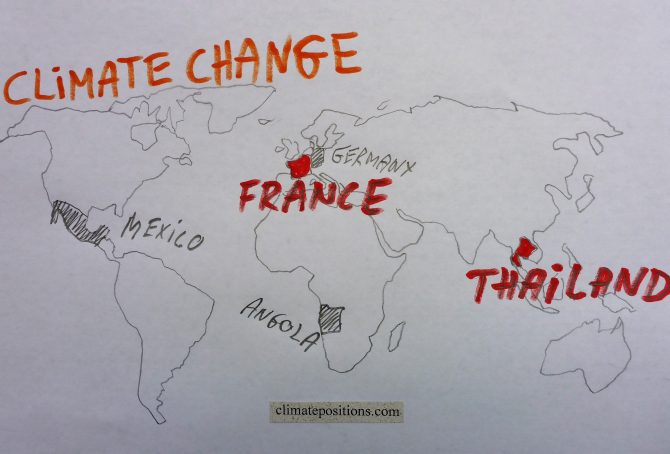
Climate change performance: Thailand vs. France
2017
Thailand and France are the world’s 19th and 20th largest emitters of CO2 from Fossil Fuels and cement. Combined, the two countries were responsible for 1.8% of world CO2 Emissions in 2015. The following examines the ‘Indicators‘ of CO2 Emissions, GDP(ppp-$), Ecological Footprint, Forest Cover and Nuclear Power.
The diagrams below show the per capita CO2 Emissions from Fossil Fuel (without bunkers) and cement, since 2000. The green bars show the Free Emission Level¹ – the exceedance is the basis for calculating the national Climate Debt.
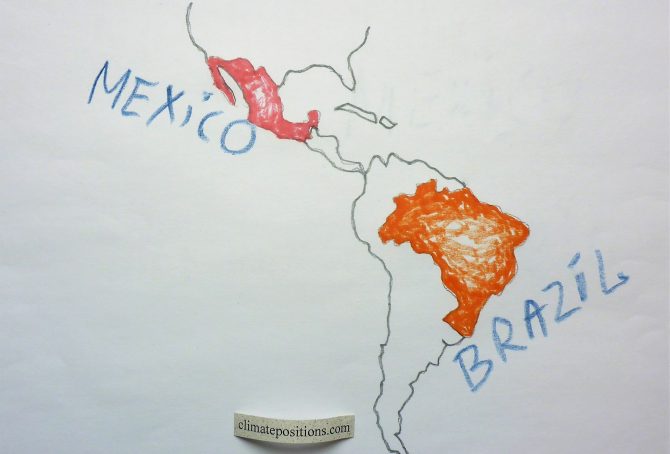
Climate change performance: Brazil vs. Mexico
2017
Brazil and Mexico are the world’s 11th and 12th largest emitters of CO2 from Fossil Fuels and cement. Combined, the two countries were responsible for 2.8% of world CO2 Emissions in 2015. The following examines the ‘Indicators‘ of CO2 Emissions, GDP(ppp-$), Forest Cover, Primary Forest and Ecological Footprint (without carbon footprint).
The diagrams below show the per capita CO2 Emissions from Fossil Fuel (without bunkers) and cement, since 2000. The green bars show the Free Emission Level¹ – the exceedance is the basis for calculating the national Climate Debt.
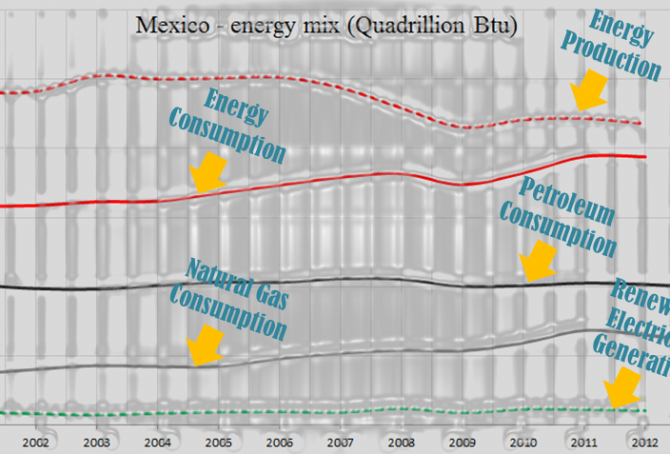
Mexico – the world’s 14th largest CO2 emitter (with an enormous solar potential)
Mexico’s current Climate Debt is $346 per capita and the ‘Ranking’ was 56th among 148 countries by January 2016. The following examines the Mexican CO2 Emissions, Climate Debt, Environmental Performance and GDP(ppp-$), in comparison with the United States, China, Brazil and Germany.

Preliminary Carbon Dioxide Emissions 2014, by country
2015
’The Global Carbon Project’ at Carbon Dioxide Information Analysis Center (CDIAC) has published preliminary CO2 Emissions from fossil fuels and cement for 2014, for more than 200 countries. The data is being used in a preliminary calculation of accumulated Climate Debt in ClimatePositions¹. The table below shows the estimated per capita emissions plus the updated Climate Debts, of the twenty largest total emitters (responsible for 77% of the global emissions in 2014).
Climate change performance of Venezuela, Chile and Mexico
2015
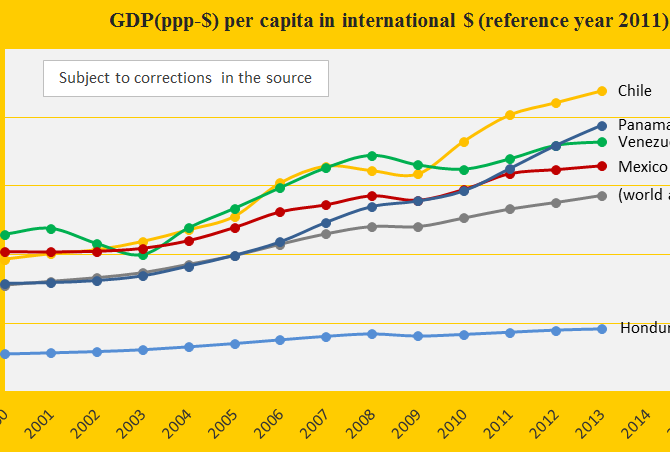
Venezuela, Chile and Mexico are ranked 42nd, 44th and 58th among 147 countries on the worst performing list in ClimatePositions (see the ‘ranking’). Their updated Climate Contributions (climate debt) are respectively $697, $561 and $313 per capita. The first diagram shows the GDP(ppp-$) per capita of the three countries, in comparison with Panama, Honduras and the world average. Chile is the third wealthiest country in the America’s after (far after!) the United States and Canada – Honduras is the second poorest after Nicaragua.
Forest Cover, Primary Forests and climate debt
2014
The national data of Forest Cover and Primary Forest are both included in the calculations of Climate Contributions (debt) in ClimatePositions. Primary Forest was included as an indicator in the worksheet in August 2014. The following describes selected findings on forests from FAO’s ‘The Global Forest Resources Assessments (FRA), 2010’ (main report, pdf, 378 pages). The Assessment is based on two primary sources of data: 1) ‘country reports’ and 2) remote sensing conducted by FAO and partners.
Climate performance of Mexico and neighboring countries
2014
The Mexican CO2 Emissions per capita over time are similar to the world trend (see the diagram) and Mexico is the world’s 12th largest CO2 emitter. Together with the neighboring countries Mexico represent the full range of Climate Contributions (climate debt) worldwide. The following examines the statistics of Mexico in comparison with United States, Guatemala, El Salvador and Honduras.

Putin’s Russia is deteriorating ecologically
2013
Russia was the world’s third largest CO2 Emitter (carbon dioxide) in 2006-2010 and the authoritarian regime was the 31st worst performing country in ClimatePositions 2010. In 2005 the ranking was 34th and in 2000 43rd. The negative development under Putin is unquestionable.
Guatemala is close to being Contribution Free
2013
Guatemala was the 82nd worst performing country out of 145 full data countries in ClimatePositions 2010. The national Contribution (climate debt) was $4 per capita, but in the latest calculation this amount is cut in half thanks to decreasing CO2 Emissions (carbon dioxide) in 2011 (see the front diagram). In a few months Guatemala may be Contribution Free.