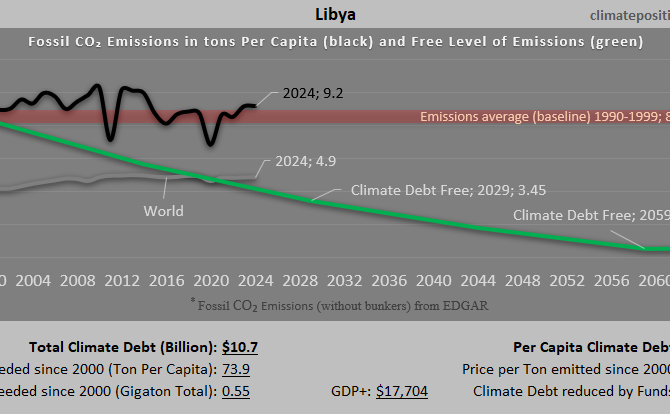
Climate Debt of Libya 2025: $10.7 Billion or 0.12% of the Global Climate Debt (or $1453 Per Capita)
/2025/ Libya ranks 40th in Climate Debt Per Capita accumulated 2000-2025. Below are some key figures in the calculations. The diagram above shows the Fossil CO2 Emissions Per Capita and the Free Level of emissions (green). The wide straight red line shows emissions in the 1990s (baseline in the calculations).
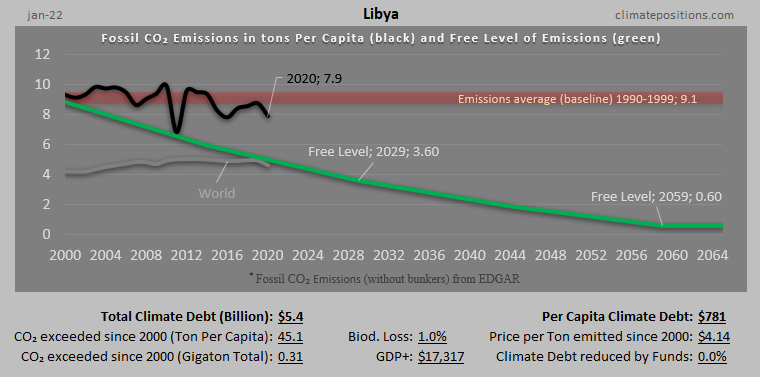
Libya: Per Capita Climate Debt $1,558 (Ranked 38) – Fossil CO2 Emissions

In 2024, Libya is responsible for 0.14% of the Global Climate Debt accumulated since 2000. Below are some key figures in the calculations.

Algeria – per capita Fossil CO2 Emissions and Climate Debt
2020
Algeria’s current Climate Breakdown Pricing amounts to $5.56 per tons Fossil CO2 emitted since 2000. The Climate Debt grew from $150 per capita in 2015 to $346 in 2020. Updated Rankings of 165 countries are available in the menu “Climate Debt”.
The following diagrams expose the trends of Fossil CO2 Emissions, Climate Debt, GDP(ppp-$) and Ecological Footprint without carbon.

Iraq – per capita Fossil CO2 Emissions and Climate Debt
2020
Iraq’s current Climate Breakdown Pricing amounts to $4.04 per tons Fossil CO2 emitted since 2000. The Climate Debt grew from $66 per capita in 2015 to $303 in 2020. Updated Rankings of 165 countries are available in the menu “Climate Debt”.
The following diagrams expose the trends of Fossil CO2 Emissions, Climate Debt, GDP(ppp-$) and Ecological Footprint without carbon.

Egypt – per capita Fossil CO2 Emissions and Climate Debt
2020
Egypt’s current Climate Breakdown Pricing amounts to $3.58 per tons Fossil CO2 emitted since 2000. The Climate Debt grew from $79 per capita in 2015 to $161 in 2020. Updated Rankings of 165 countries are available in the menu “Climate Debt”.
The following diagrams expose the trends of Fossil CO2 Emissions, Climate Debt and GDP(ppp-$).
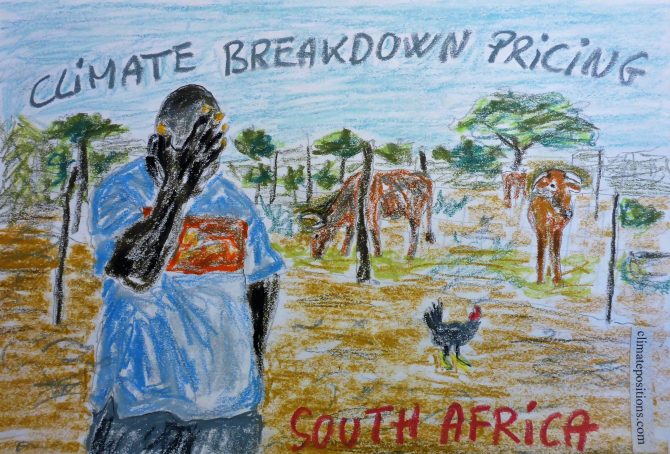
South Africa – per capita Fossil CO2 Emissions and Climate Debt
2020
South Africa’s current Climate Breakdown Pricing amounts to $8.30 per tons Fossil CO2 emitted since 2000. The Climate Debt grew from $593 per capita in 2015 to $1,355 in 2020. Updated Rankings of 165 countries are available in the menu “Climate Debt”.
The following diagrams expose the trends of Fossil CO2 Emissions, Climate Debt, GDP(ppp-$) and Ecological Footprint without carbon.
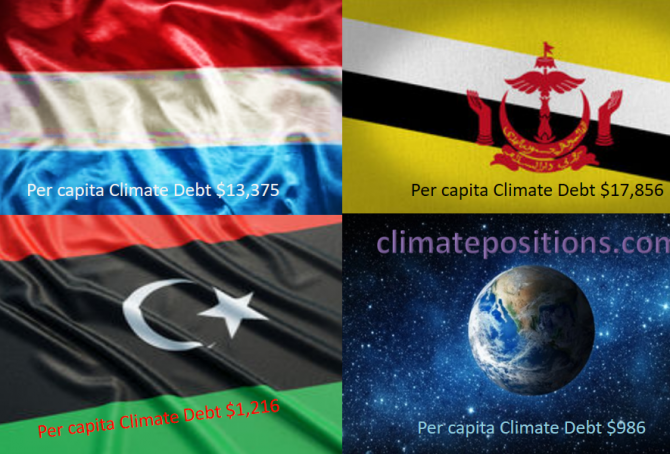
Share of global Climate Debt rank 49th, 50th and 51st: Luxembourg, Libya and Brunei (combined responsible for 0.32% of Climate Debt and 0.20% of Fossil CO2 Emissions 2016)
2017
The diagram below shows ‘Share of global Climate Debt‘ in 2010, 2015 and 2017 of Luxembourg, Libya and Brunei (ranked 49th, 50th and 51st). The shares of Luxembourg and especially Libya are decreasing, whereas Brunei’s share is increasing.
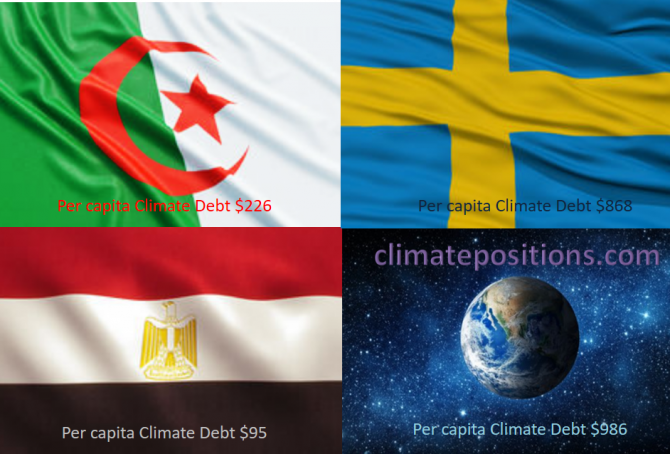
Share of global Climate Debt rank 46th, 47th and 48th: Algeria, Egypt and Sweden (combined responsible for 0.37% of Climate Debt and 1.18% of Fossil CO2 Emissions 2016)
2017
The diagram below shows ‘Share of global Climate Debt‘ in 2010, 2015 and 2017 of Algeria, Egypt and Sweden (ranked 46th, 47th and 48th). The Algerian share has increased continuously, whereas the Egyptian and the Swedish shares appear to have peaked around 2015.

Climate change performance of Libya, Algeria, Tunisia and Morocco (refugees and the European Union)
2015
A devilish combination of poverty, armed conflict and violence in parts of Africa and Middle East, sends flows of refugees in boats across the Mediterranean Sea to Europe via Spain, Italy, Malta and Greece. In 2014 around 150,000 survived the dangerous trip to Italy alone. However, the European Union (EU) offers (as it seems) only a total of 5,000 resettlement places across Europe and the vast majority of all refugees will be sent back as irregular migrants. Read this ‘article’ from The Guardian.
How green are the fossil fuel producers? (Correlation between fossil fuel production, CO2 Emissions, GDP and Climate Debt)
2015
Greenhouse gas emissions from burning of fossil fuels (oil, natural gas and coal), is the main cause of manmade climate change. Comparable energy potentials of oil, natural gas and coal is defined as “tons oil equivalents”, meaning that the energy released from a given quantity of natural gas or coal is equivalent to one ton of oil. This way the total production of fossil fuels can be expressed in a single figure (not to be confused with market value, global warming potential or general usefulness) The world’s production in million tons oil equivalent, was in 2013: oil (4,130), natural gas (3,041 and coal (3,881).
The table below ranks the twenty countries with the largest per capita fossil fuel production (oil equivalents). Total production data of 68 countries is from ‘BPs Statistical Review of World Energy 2014’ (pdf, 48 pages).
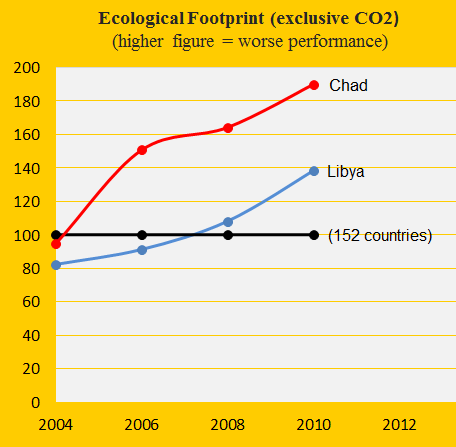
Climate performance: Libya versus Chad
2014
Libya was the 29th worst performing country out of 145 in ClimatePositions 2010 and thus the worst performing country in Africa (read more ‘here’). The authoritarian oil-regime’s Climate Contribution (climate debt) has increased to $819 per capita in the updated calculation. Chad is Contribution Free in spite of a surprisingly large Ecological Footprint (excluding CO2 Emissions) – see the diagram. The large footprint is partly due to large herds of commercial cattle, goats, sheep, horses and donkeys. The following examines the indicators: CO2 Emissions, GDP(ppp-$) and the Climate Contributions over time.