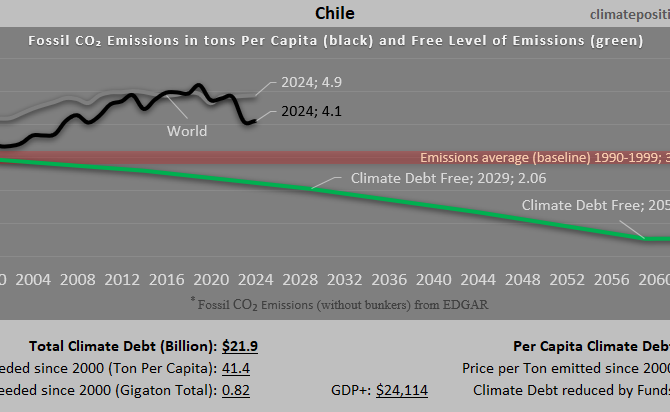
Climate Debt of Chile 2025: $22 Billion or 0.24% of the Global Climate Debt (or $1111 Per Capita)
/2025/ Chile ranks 48th in Climate Debt Per Capita accumulated 2000-2025. Below are some key figures in the calculations. The diagram above shows the Fossil CO2 Emissions Per Capita and the Free Level of emissions (green). The wide straight red line shows emissions in the 1990s (baseline in the calculations).
Chile – per capita Fossil CO2 Emissions and Climate Debt
2020
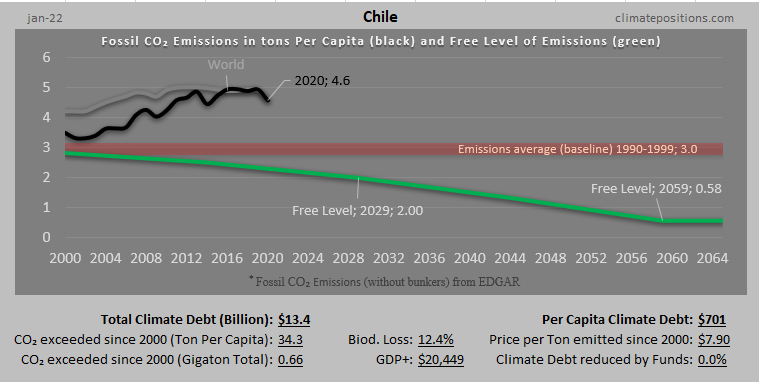
Chile’s current Climate Breakdown Pricing amounts to $11.78 per tons Fossil CO2 emitted since 2000. The Climate Debt grew from $437 per capita in 2015 to $934 in 2020. Updated Rankings of 165 countries are available in the menu “Climate Debt”.
The following diagrams expose the trends of Fossil CO2 Emissions, Climate Debt, GDP(ppp-$), Forest Cover, Primary Forest and Ecological Footprint without carbon.

Venezuela – per capita Fossil CO2 Emissions and Climate Debt (economic collapse)
2020
Venezuela’s current Climate Breakdown Pricing amounts to $10.04 per tons Fossil CO2 emitted since 2000. The Climate Debt grew from $655 per capita in 2015 to $1,045 in 2020. However, once updated data on national GDP(ppp-$) is released, then the current Climate Debt will prove to be considerably smaller (more below). Updated Rankings of 165 countries are available in the menu “Climate Debt”.
The following diagrams expose the trends of Fossil CO2 Emissions, GDP(ppp-$), Climate Debt, Forest Cover, Primary Forest and Ecological Footprint without carbon.

Argentina – per capita Fossil CO2 Emissions and Climate Debt
2020
Argentina’s current Climate Breakdown Pricing amounts to $10.19 per tons Fossil CO2 emitted since 2000. The Climate Debt grew from $420 per capita in 2015 to $928 in 2020. Updated Rankings of 165 countries are available in the menu “Climate Debt”.
The following diagrams expose the trends of Fossil CO2 Emissions, Climate Debt, GDP(ppp-$) and Ecological Footprint without carbon.
Brazil – per capita Fossil CO2 Emissions and Climate Debt
2020
Brazil’s current Climate Breakdown Pricing amounts to $5.74 per tons Fossil CO2 emitted since 2000. The Climate Debt grew from $108 per capita in 2015 to $246 in 2020. Updated Rankings of 165 countries are available in the menu “Climate Debt”.
The following diagrams expose the trends of Fossil CO2 Emissions, Climate Debt, GDP(ppp-$), Ecological Footprint without carbon, Forest Cover and Primary Forest.
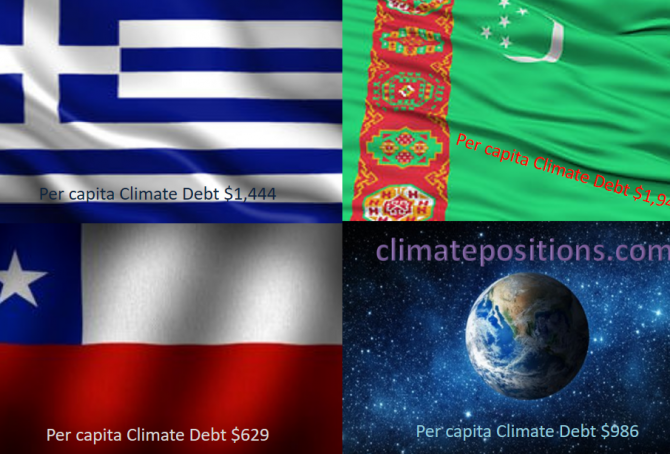
Share of global Climate Debt rank 40th, 41st and 42nd: Greece, Chile and Turkmenistan (combined responsible for 0.52% of Climate Debt and 0.64% of Fossil CO2 Emissions 2016)
2017
The diagram below shows ‘Share of global Climate Debt‘ in 2010, 2015 and 2017 of Greece, Chile and Turkmenistan (ranked 40th, 41st and 42nd). The share of Greece is decreasing, while the shares of Chile and Turkmenistan are increasing.
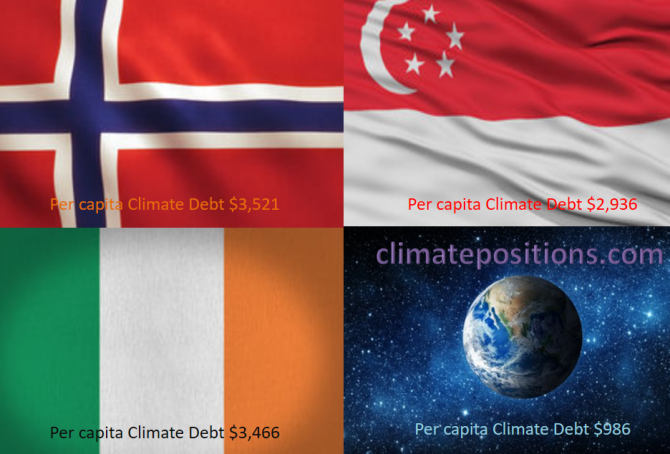
Share of global Climate Debt rank 37th, 38th and 39th: Norway, Ireland and Singapore (combined responsible for 0.71% of Climate Debt and 0.37% of Fossil CO2 Emissions 2016)
2017
The diagram below shows ‘Share of global Climate Debt‘ in 2010, 2015 and 2017 of Norway, Ireland and Singapore (ranked 37th, 38th and 39th). Norway’s share is decreasing, whereas Singapore’s is increasing. Ireland’s impressive decrease seems to have reversed lately.
Climate change performance of Venezuela, Chile and Mexico
2015
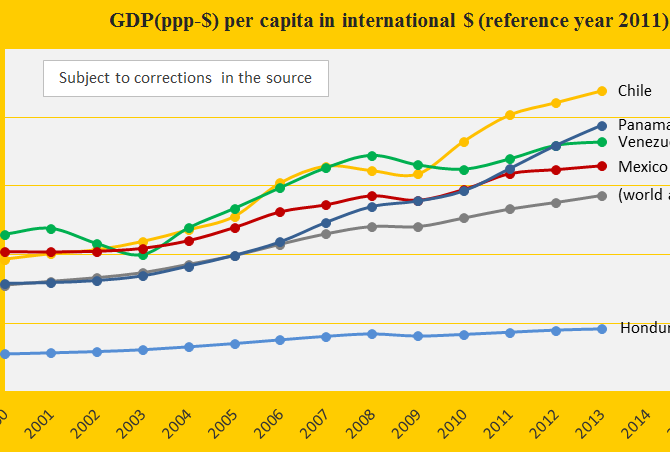
Venezuela, Chile and Mexico are ranked 42nd, 44th and 58th among 147 countries on the worst performing list in ClimatePositions (see the ‘ranking’). Their updated Climate Contributions (climate debt) are respectively $697, $561 and $313 per capita. The first diagram shows the GDP(ppp-$) per capita of the three countries, in comparison with Panama, Honduras and the world average. Chile is the third wealthiest country in the America’s after (far after!) the United States and Canada – Honduras is the second poorest after Nicaragua.
Venezuela loses big to Colombia in climate responsibility
2014
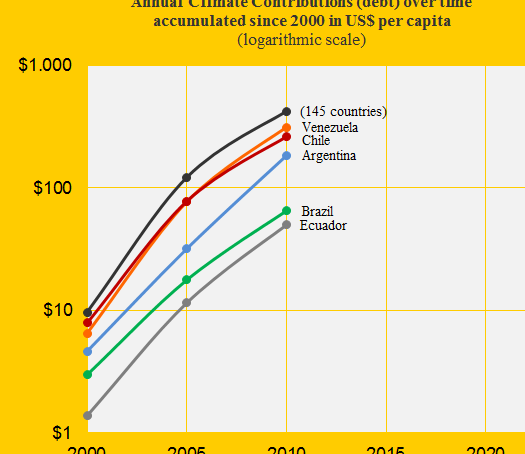
Colombia was Contribution Free in ClimatePositions 2010 and Venezuela was the 43rd worst performing country out of 145 (see the menu “Contributions”). The Venezuelan Climate Contribution (climate debt) was $313 per capita which was the 3rd largest in America after the extreme polluters United States and Canada. The diagram shows the Climate Contributions over time per capita of Venezuela, Chile, Argentina, Brazil, Ecuador and the world average (145 countries). In the updated calculation Venezuela’s Contribution has increased to $428 per capita (worsened two country rankings). The following examines Colombia’s and Venezuela’s CO2 Emissions, Ecological Footprint, Environmental Performance and forest cover.