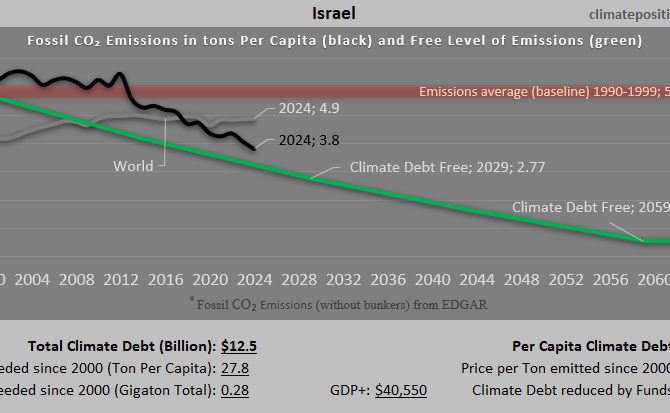
Climate Debt of Israel 2025: $12.5 Billion or 0.14% of the Global Climate Debt (or $1255 Per Capita)
/2025/ Israel ranks 44th in Climate Debt Per Capita accumulated 2000-2025. Below are some key figures in the calculations. The diagram above shows the Fossil CO2 Emissions Per Capita and the Free Level of emissions (green). The wide straight red line shows emissions in the 1990s (baseline in the calculations).
Israel: Per Capita Climate Debt $1,069 (Ranked 47) – Fossil CO2 Emissions
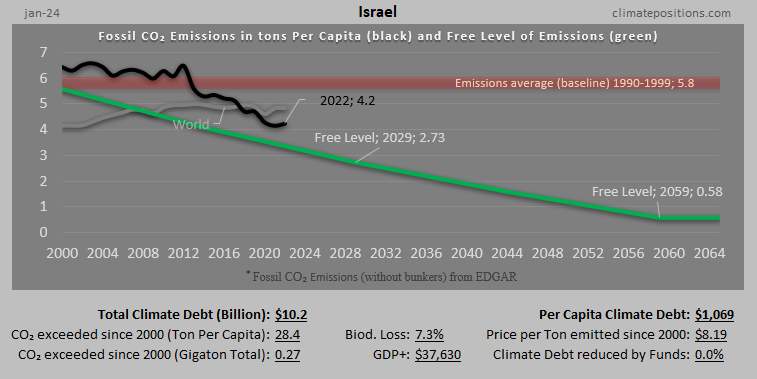
In 2024, Israel is responsible for 0.13% of the Global Climate Debt accumulated since 2000. Below are some key figures in the calculations.

Oman – per capita Fossil CO2 Emissions and Climate Debt
2020
Oman’s current Climate Breakdown Pricing amounts to $44.28 per tons Fossil CO2 emitted since 2000. The Climate Debt grew from $9,261 per capita in 2015 to $13,602 in 2020. Updated Rankings of 165 countries are available in the menu “Climate Debt”.
The following diagrams expose the trends of Fossil CO2 Emissions, Climate Debt, GDP(ppp-$), Population growth and Ecological Footprint without carbon.

Kuwait – per capita Fossil CO2 Emissions and Climate Debt
2020
Kuwait’s current Climate Breakdown Pricing amounts to $67.33 per tons Fossil CO2 emitted since 2000. The Climate Debt grew from $23,049 per capita in 2015 to $35,570 in 2020. Kuwait is the second most climate-criminal nation on the planet. Updated Rankings of 165 countries are available in the menu “Climate Debt”.
The following diagrams expose the trends of Fossil CO2 Emissions, Climate Debt, GDP(ppp-$) and Ecological Footprint without carbon.

Egypt – per capita Fossil CO2 Emissions and Climate Debt
2020
Egypt’s current Climate Breakdown Pricing amounts to $3.58 per tons Fossil CO2 emitted since 2000. The Climate Debt grew from $79 per capita in 2015 to $161 in 2020. Updated Rankings of 165 countries are available in the menu “Climate Debt”.
The following diagrams expose the trends of Fossil CO2 Emissions, Climate Debt and GDP(ppp-$).

Iran – per capita Fossil CO2 Emissions and Climate Debt
2020
Iran’s current Climate Breakdown Pricing amounts to $15.69 per tons Fossil CO2 emitted since 2000. The Climate Debt grew from $1,095 per capita in 2015 to $2,153 in 2020. Updated Rankings of 165 countries are available in the menu “Climate Debt”.
The following diagrams expose the trends of Fossil CO2 Emissions, Climate Debt, GDP(ppp-$), Ecological Footprint (without carbon) and Nuclear Power.
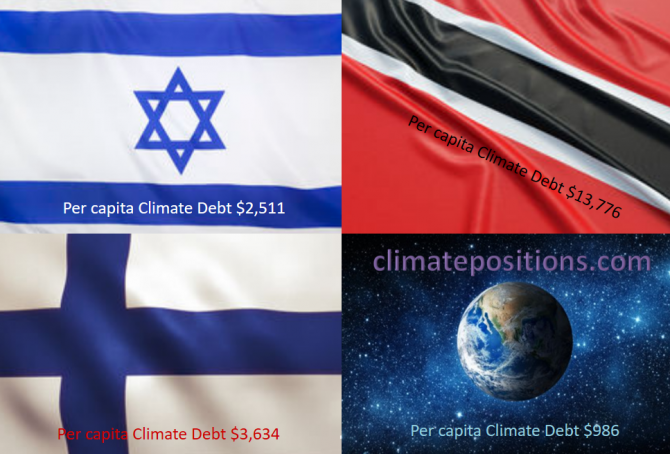
Share of global Climate Debt rank 34th, 35th and 36th: Israel, Finland and Trinidad and Tobago (combined responsible for 0.83% of Climate Debt and 0.42% of Fossil CO2 Emissions 2016)
2017
The diagram below shows ‘Share of global Climate Debt‘ in 2010, 2015 and 2017 of Israel, Finland and Trinidad and Tobago (ranked 34th, 35th and 36th). The shares of Israel and Finland have decreased continuously, whereas the one of Trinidad and Tobago is nearly stable.
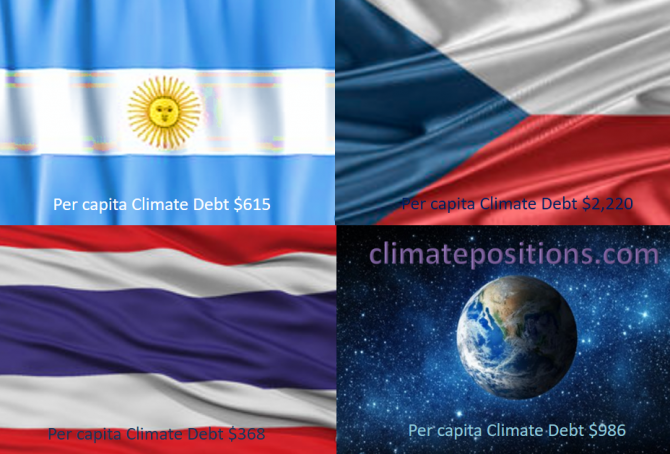
Share of global Climate Debt rank 31st, 32nd and 33rd: Argentina, Thailand and Czech Republic (combined responsible for 1.0% of Climate Debt and 1.6% of Fossil CO2 Emissions 2016)
2017
The diagram below shows ‘Share of global Climate Debt‘ in 2010, 2015 and 2017 of Argentina, Thailand and Czech Republic (ranked 31st, 32nd and 33rd). The share of Argentina is increasing while the share of Thailand has flattened out.

Climate Debt: Norway ranks 9th (performance of top twenty from Human Development Index)
The so called ‘Human Development Index 2015’ (UN) ranks Norway 1st among 188 countries. The index is based on 1) Life expectancy at birth, 2) Expected years of schooling, 3) Mean years of schooling and 4) Gross national income (GNI) per capita. However, the wealthy Scandinavian oil state ‘Ranks‘ 9th among 148 countries on Climate Debt per capita. Norway is in other words a highly human developed demolisher of the climate, one might say! The following examines the climate performance of Norway in comparison with the other top five countries from Human Development Index: Australia, Switzerland, Denmark and Netherland.

Climate change performance of Israel, Lebanon and Jordan (refugees from the Syrian Civile War)
2015
The ‘Syrian Civil War’ and other violent conflicts in the region are causing huge numbers of refugees. According to ‘The UN Refugee Agency (UNHCR)’ around 1.2 million refugees lived in Lebanon by December 2014, which was 28% of the usual population. In Jordan, the percentage of refugees was 10% and in Israel 0.5%. For comparison, the world average is about 0.8% (60 million refugees globally). Under these tragic circumstances carbon dioxide emissions and Climate Debt is of cause inconsiderate to discuss, but on the other hand, manmade climate destruction also causes mass refugees, mutilation and death … with increasing force in the coming decades. Experts foresee about 200 million climate refugees by 2050, or about 2% of the projected global population of 10 billion. Or roughly speaking: Two-thirds more refugees, due to climate change alone, in a world with one-third more people – in 35 years.

Climate performance of Israel, Occupied Palestinian Territories and neighboring countries
2014
Israel was the 16th worst performing country out of 145 in ClimatePositions 2010 with a Climate Contribution of $1,790 per capita (see the ranking in the menu “Calculation”). The Palestinian Territories (Gaza Strip and West Bank, both occupied by Israel) were in reality Contribution Free (though excluded from the inventory due to lack of indicator data¹). The following examines the statistics of Israel, the Occupied Palestinian Territories, Lebanon, Jordan, Syria and Egypt.