During COP15 in Copenhagen in 2009, the horrifying truth dawned on me: the rich countries which are largely responsible for the climate change, will not contribute to a binding global climate agreement. Shortly after the summit, I began my search for knowledge and attempt to place the national moral responsibility for the collapse of common sense in the world community. Before COP19 in Warsaw in 2013 the site climatepositions.com was presented. (Claus Andersen, 2013)
Since 2013 several changes of calculation methods and Indicators have been made, however, the original concept of a fair Climate Damage Pricing or Climate Debt worldvide is unchanged.
The diagrams below illustrates the calculation approach since January 2022. New indicator is Biodiversity Loss, which replaces Ecological Footprint, Environmental Performance and Forest Cover (and Primary Forest). These changes favor some countries as compared to others. Also, the general level of accumulated Climate Debt has been reduced to around half (the level of Climate Debt worldwide is not science based).
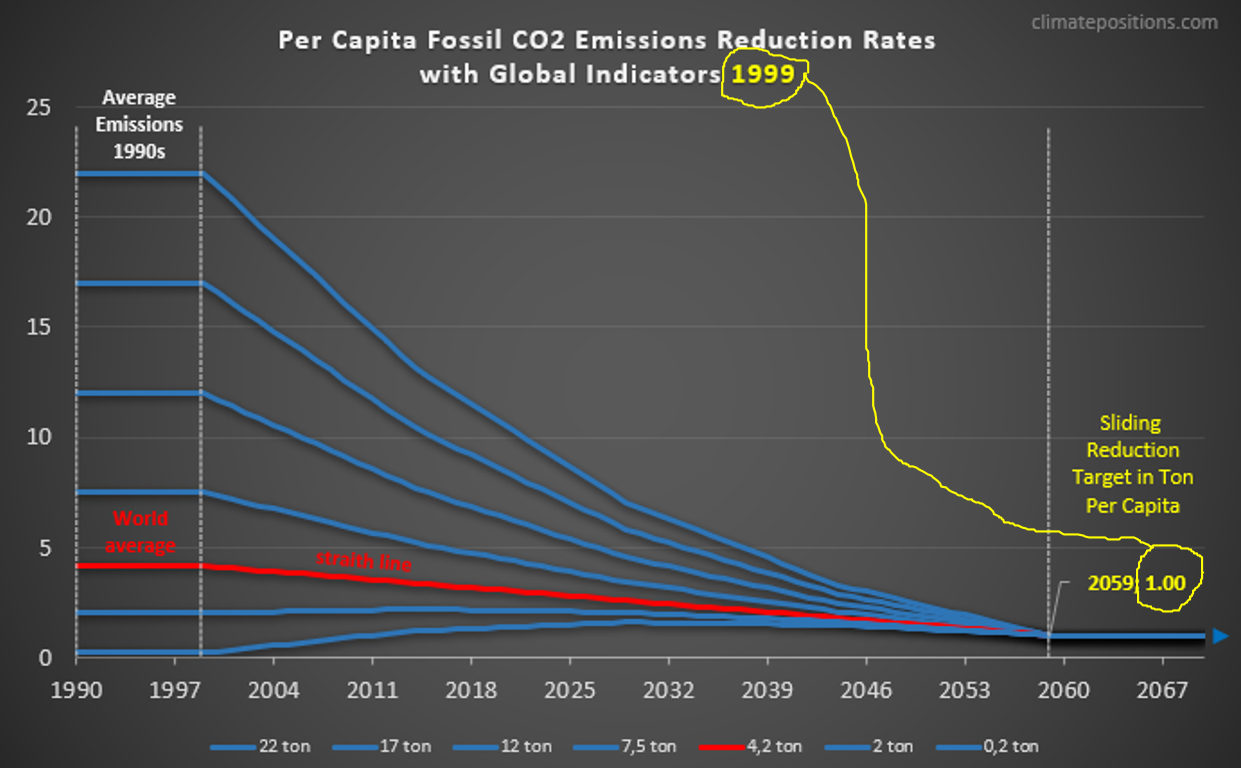
The first diagram (below) shows the general concept since January 2022. All countries on Earth must basically reduce Fossil CO2 Emissions Per Capita towards the same “sliding” Global Reduction Target by 2059. Baseline for national Reduction Rates are Per Capita Fossil CO2 Emissions 1990-1999. The Reduction Rate is called “Free Level” of Emissions in ClimatePositions. The accumulated CO2 exceedance since 2000 is the Calculation Basis (Ton CO2) of the Climate Damage Pricing (Int. $). National wealth (GDP-ppp Per Capita) determines the actual amount, meaning that e.g. dobble GDP-ppp results in dobble Climate Damage Pricing. The Climate Debt arises by deducting Climate Funds (Climate Change finansing) from Climate Damage Pricing.
World average Fossil CO2 Emissions (World baseline: 4.2 ton (or 4,2 ton)) is set to a straith reduction line (red line in the diagram below). The Global Reduction Target by 2059 is set at 1.00 ton of Fossil CO2 Per Capita with Global Indicators 1999 (yellow bubbles). Global Indicators are 1) Global Warming, 2) CO2 in the Atmosphere and 3) Global Population. Increasing values of Global Indicators leads to a lower Global Reduction Target (closer to zero Fossil CO2 Emissions).
The Kuwait-diagram below is a screenshot from the Calculation (Excel) January 2022 (available in the menu “Calculation (Excel)”). The reddish belt shows the average Fossil CO2 Emissions Per Capita 1990-1999 (21.7 ton). The green line is the current Free Level of CO2 Emissions. Currently, Kuwaits Free Level is 6.78 ton by 2029 and 0.61 ton by 2059.
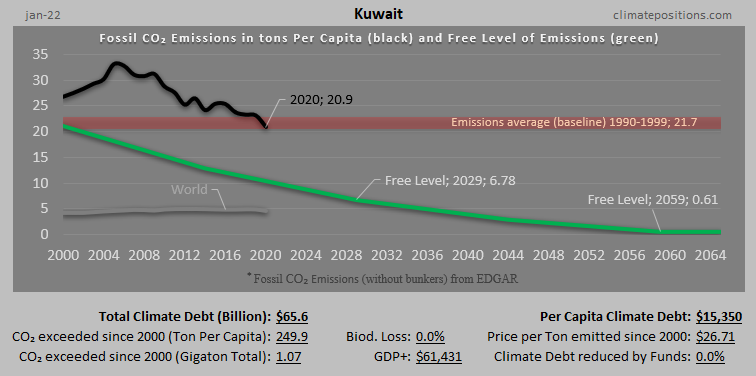
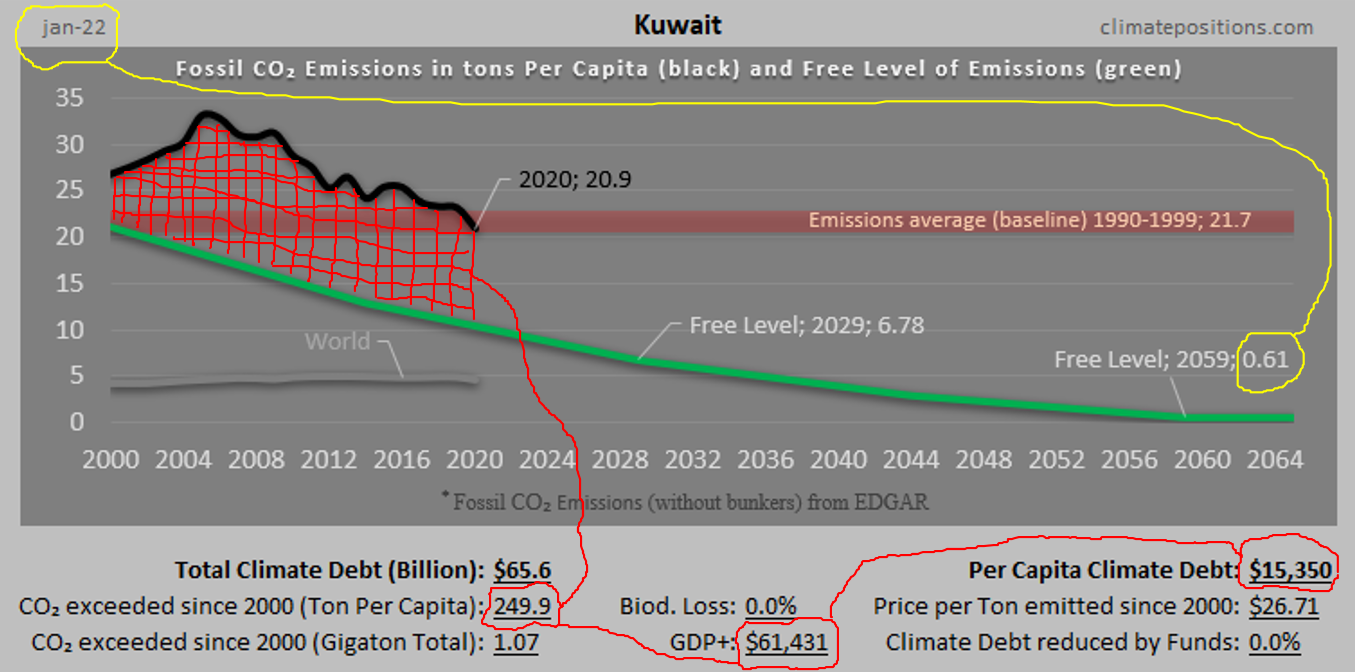
The yellow bubbles in third diagram (below) show the impact of the rising Global Indicators between 1999 and 2022: The Reduction Target 2059 has decreased from 1,00 ton Per Capita to 0.61 ton (0.39 ton decrease in 23 years).
The red hatching between the actual Fossil CO2 Emissions Per Capita (black line) and the Free Level of Emissions (green line) shows the CO2 exceedance (red bubble: 249.9 tons). The CO2 exceedance times GDP+ (red bubble: $61431) yields the Climate Damage Pricing. The Climate Debt (red bubble: $15350 Per Capita) arises by deducting Climate Funds (Climate Change financing) from Climate Damage Pricing.
GDP+ is GDP-ppp since 2000, where the average of the last five years counts equally (50%) with the average of the previous years (50%). This method ensures a conservative growth in Climate Debt compared to the national wealth.
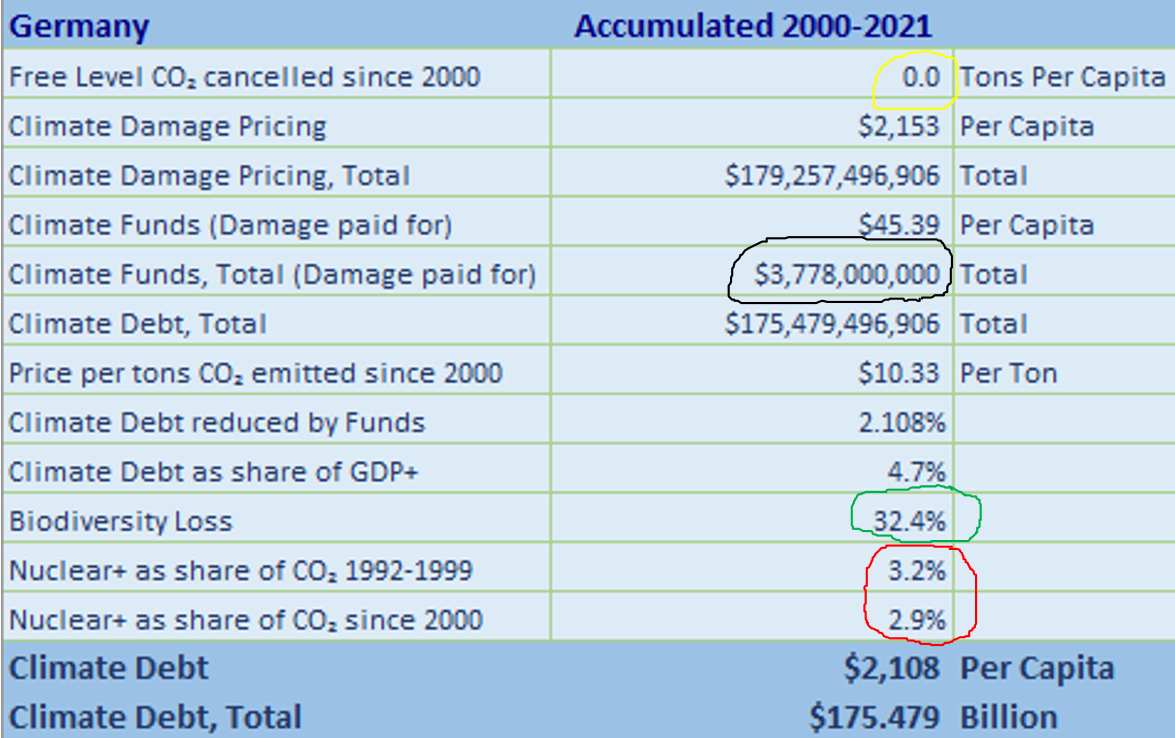
The impact of the indicators Biodiversity Loss and Nuclear Power+ are illustrated with two screenshots of Germany from the Calculation (Excel).
The Biodiversity Loss at 32.4% alone reduces the Free Level Target 2059 from 0.61 ton to 0.54 ton. Combined with Nuclear Power+ the Free Level Target 2059 is reduced to 0.26 ton (lowest yellow bubble). Nuclear Power+ is equated with natural gas in the sense that the Nuclear Power generation is “pretended” to be generated with burning natural gas with respect to CO2 Emissions. Consequently, Nuclear Power must be phased out at the same rate as natural gas.

The screenshot below shows some key figures from the Calculation (Excel).
The yellow bubble is only relevant for countries with Emissions far below Free Level. In this scenario a large part of the unused Free Level is canselled.
The black bubble shows the accumulated deposited Multilateral Climate Funds (Climate Change Finansing). The amount is deducted from the Climate Damage Pricing to reach the Climate Debt.
The green bubble shows the percent of Biodiversity Loss (the source emphasizes that the inventory is still only a Beta version with gaps). In the calculation Biodiversity Loss lowers the Free Level (the green line) and thus increases the Climate Debt.
The red bubble indicates the trend of Nuclear Power generation before, and after, 2000, as share of the Fossil CO2 Emissions, calculated as if the Nuclear Power was generated with burning natural gas. The main problem with Nuclear Power is the unsolved problem with storage of the radioactive waste.