Australia perform worst of democratic countries
2013
Australia was the 6th worst performing country in the world in ClimatePositions 2010 with a Climate Contribution of $4,387 per capita. In the latest calculation it had increased to $5,081. The total national Contribution (climate debt) is now 109 billion US$. Since no country in top 5 is Full Democracies, Australia is the worst performing democratic country. It can be assumed that the majority of the Australian voters are pleased with this destructive approach to the planet.
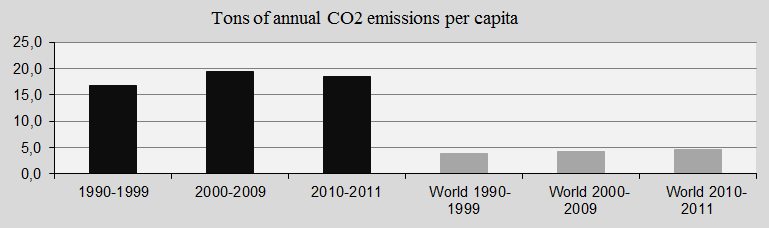
Coal mining is big in Australia and the production is the fourth largest in the world after China, United States and India. Coal as an energy source is disastrous in terms of CO2 Emissions (carbon dioxide). The diagram below shows Australia’s annual CO2 Emissions in tons per capita in the decades 1990-1999 and 2000-2009, and in 2010-2011 (the black bars). For comparison, the gray bars show the average global CO2 Emissions per capita.
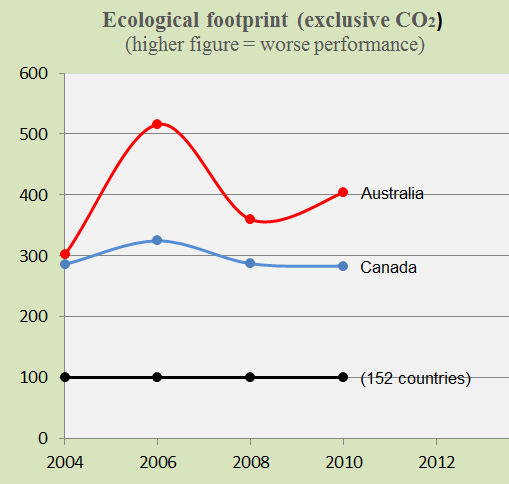
The Australian Ecological Footprint (without CO2 Emissions) was the fourth largest in 2010 after Denmark, Uruguay and Mongolia. The diagram below shows the development since 2004 compared with Canada and the global average set at 100.
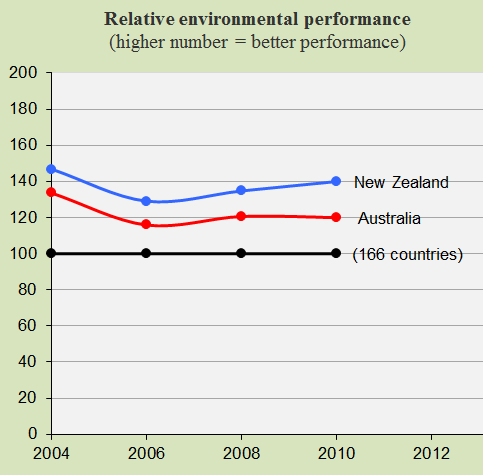
When it comes to Environmental Performance (the diagram below) Australia is doing slightly better than the global average. Compared to for example New Zealand, Australia is failing, however.
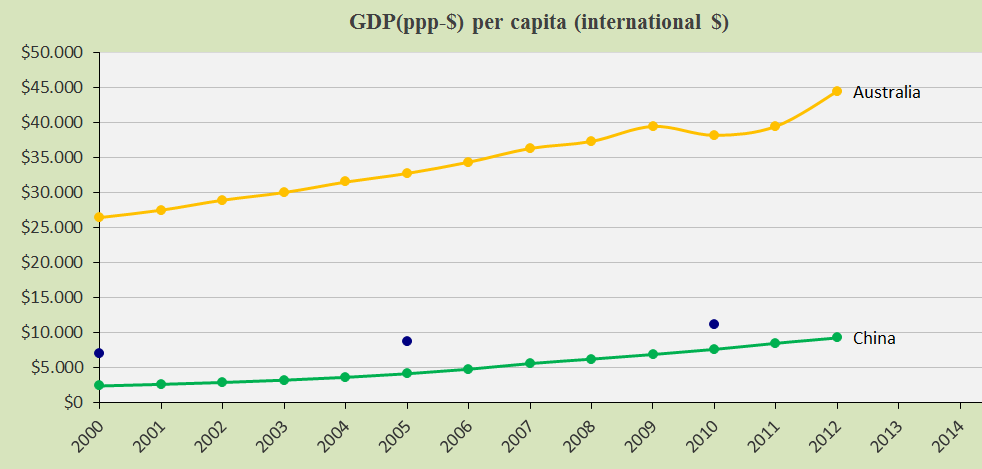
In national wealth Australia is in top 10. See the gap between for example China and Australia in GDP(ppp-$) per capita in the diagram below. The blue dots are the global average.
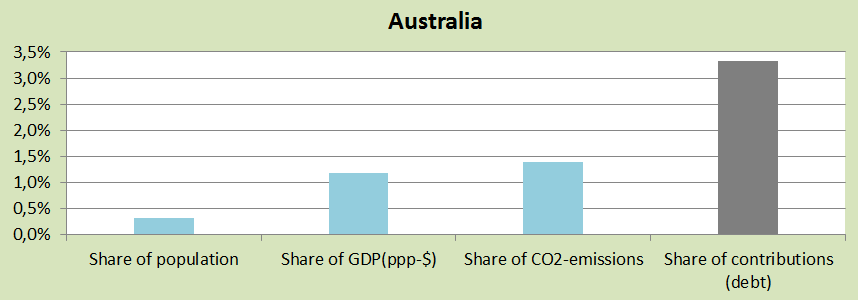
The remaining indicators of significance for the national Climate Contribution can be studied in the submenu “Calculations (Excel)”. The last diagram show Australia’s total share of the global: 1) Population (0.32%), 2) GDP(ppp-$) (1.19%), 3) CO2 Emission (1.40%) and 4) Contribution (3.33%). Cynicism towards the planet and future generations is good business these days.
Source on CO2 emissions: EIA, U.S. Energy Information Administration (links in the menu “Calculations”).
Data sources on ecological footprint: WWF reports “The Living Planet” published 2006-2012 (links in the menu “Calculations”).
Data sources on environmental performance are from Yale and Columbia University reports, published 2006-2012 (links in the menu “Calculations”).
Information on national GDP(ppp-$) per capita is from Worldbank (links in the menu “Calculations”). Read about GDP+ in the submenu ”Indicators”.
Democratic Index is from Wikipedia (links in the menu “Calculations”).
Front image by Claus Andersen, 2013 (unknown photographer).
Comments are closed.