Canada now ranks 10th in Climate Debt per capita (due to black transition)
Canada covers 7.3% of planet’s land area and populates 0.5% of its people. The Climate Debt of the 35 million Canadians amounts to $183 billion, or $5,138 per capita, which ‘Ranks’ Canada 10th among 148 countries. In 2010 the ranking was 7th. The following compares the Canadian performance with the ones of Australia, New Zealand, Sweden and Finland – all wealthy developed countries with small or relatively small population density¹.
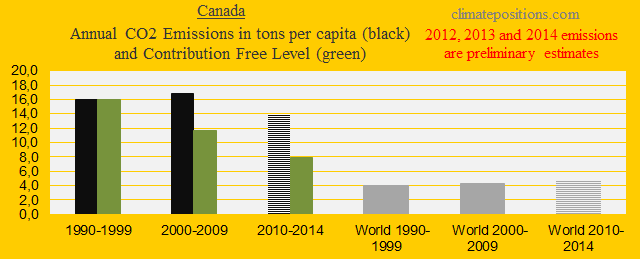
The first diagram (below) shows the per capita CO2 Emissions from fossil fuels (without bunker fuels) and cement production in decades in comparison with the world average. CO2 Emissions since 2012 are preliminary estimates. The green bars are the Contribution Free Level, determined by the level of CO2 Emissions in the 1990s and a number of continuously updated ‘Indicators’.
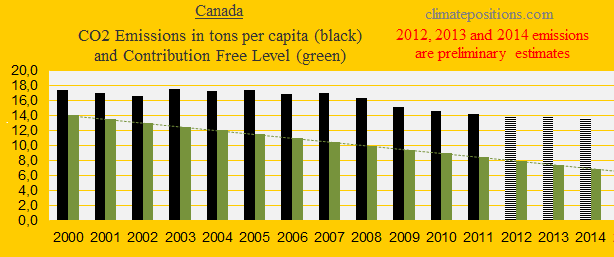
The next diagram shows the per capita CO2 Emissions from fossil fuels (without bunker fuels) and cement production since 2000. CO2 Emissions in 2012, 2013 and 2014 are preliminary estimates. The changes in energy mix causing the reductions in recent years are examined below the diagram.
Here are some key data on Canada’s energy supply (Btu):
- Total energy consumption increased almost 3% between 2000 and 2012 (the population grew 13%)
- Per capita energy consumption was 5.2 times the world average in 2012 (which is considerably higher than Australia, New Zealand, Sweden and Finland²).
- Natural gas consumption increased 26% between 2000 and 2014 (due to fracking).
- Petroleum consumption increased 19% between 2000 and 2013.
- Renewable electricity supplied 28% of the total energy consumption in both 2000 and 2012 (the convenient hydroelectricity generation supplied 95% of the renewable electricity generation in 2012).
- Coal consumption accounted for 7% of the total energy consumption in 2012, compared to 12% in 2000.
- Total CO2 Emissions from fossil fuels (without bunker fuels) and cement production decreased 9% between 2000 and 2014 (preliminary estimate).
In brief, Canada’s improved energy efficiency since 2000 has been more than eaten by the growing population and the significant cuts in CO2 Emissions is mainly due to the energy shift from coal to petroleum and natural gas from fracking.
‘The Canadian Intended Nationally Determined Contribution’ at COP21 “intends to achieve an economy-wide target to reduce its greenhouse gas emissions by 30% below 2005 levels by 2030.” If the target were to be achieved by 30% cuts in per capita CO2 Emissions from fossil fuels (without bunker fuels) and cement production, then emissions would drop from 14.1 ton in 2011 to 12.2 tons by 2030 – nothing more. This intended reduction target equals a burden for the climate as if Canada’s 1991-emissions had dropped 6% compared to 1990-level and remained at this slightly lower level of 14.7 ton the next 40 years, till 2030. The Canadian fossil fuel strategy (“black transition”: shifting from coal to oil and natural gas from fracking) might have been operational in the 1990s, when the global carbon budget was less alarming.
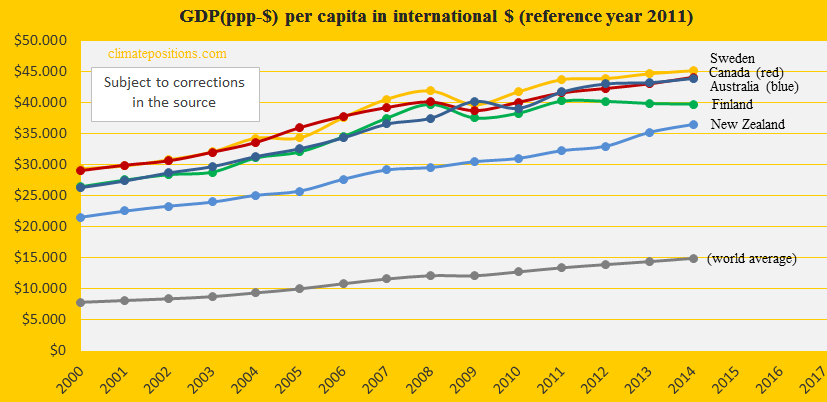
In 2014 the Canada was the 16th wealthiest country among 148 with full data in ClimatePositions. The diagram below shows the development in GDP(ppp-$) since 2000, in comparison with Australia, New Zealand, Sweden, Finland and the world average.
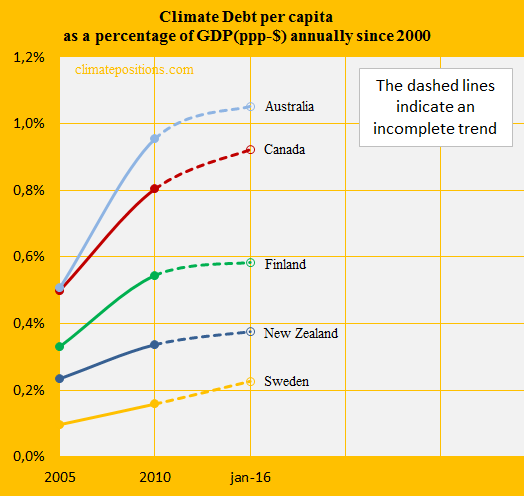
The Climate Debts share of the GDP(ppp-$), annually since 2000, was 0.92% by January 2016 (‘Ranked’ 11th). The development since 2005 is shown in the diagram below, along with the same group of countries.
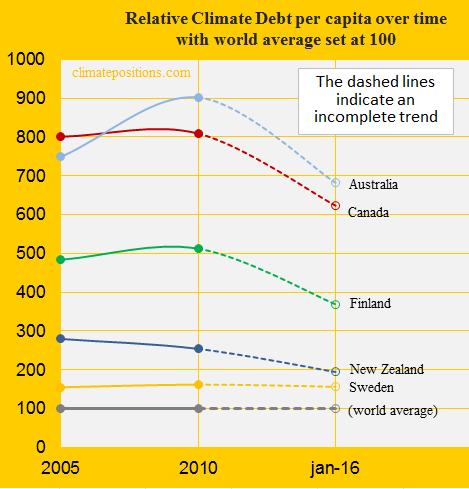
The last diagram shows the relative Climate Debt of the same countries since 2005, with the world average set at 100. Note that the dashed lines are based on preliminary estimates.
.
¹Humans per km² in 2014: World average (52.8), Sweden (18.3), New Zealand (16.3), Finland (15.6), Canada (3.5) and Australia (3.9).
²The per capita energy consumption in 2012: Canada (5.2 times the world average), Australia (3.6 times), Finland and Sweden (3.1 times) and New Zealand (2.6 times).
.
A hypothetical example: If Canada had started its CO2 Emission cuts eight years earlier, in 2000 instead of 2008, and continued the reduction rate till 2014, then the per capita Climate Debt would have been $1,374 instead of $5,155, and the ranking would have been 30th instead of 10th.
.
Updated data and diagrams of all ‘Indicators’ and all countries in ClimatePositions are available in the menu ‘Calculations (Excel)’.
Data on carbon emissions (CO2 Emissions) from fossil fuels (without bunkers) and cement production are from Global Carbon Project (CDIAC); (links in the menu “Calculations”).
Article in Huffington Post about methane from oil and natural gas: ‘The Fossil Fuel Industry Is Worse For The Climate Than We Thought‘.
Data on energy production is from ‘U.S. Energy Information Administration (EIA)’.
Information on national GDP(ppp-$) per capita: Worldbank (links in the menu “Calculations”).
Data on national and global Populations is from Worldbank (links in the menu “Calculations”).
About fracking in Canada: ‘http://www.sourcewatch.org/index.php/Canada_and_fracking‘.
Drawing by Claus Andersen, 2016.
Comments are closed.