Carbon dioxide emissions 2013 – China, the United States, India and Russia
2014
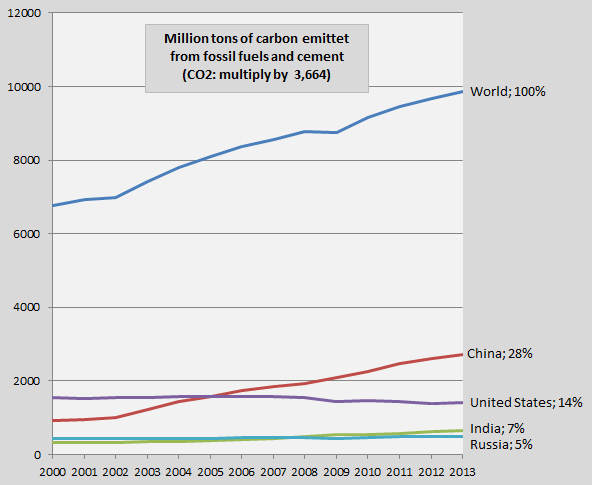
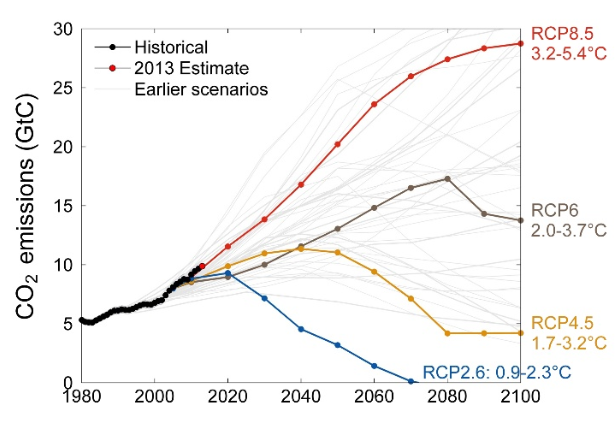
The diagram shows the global development of carbon dioxide emissions from fossil fuels and cement 2000-2013 (measured by pure carbon) and of the four largest emitters China, the United States, India and Russia. The 2013-emissions are preliminary with an enlarged uncertainty of ±5%. The national shares of the global emissions in 2013 are shown in percent to the right. The four countries accounted for 54% of the global emissions in 2013 (48% in 2000). The preliminary carbon dioxide emissions in 2013 of 216 countries is available ‘here’¹. Global emissions are on track of the worst out of four scenarios, likely heading for 3.2-5.4°C increase in temperature by 2100, since pre-industrial era (see the diagram below from ‘Global Carbon Project’, and ‘presentation (pdf)‘.
During the period 1960-2013 the carbon dioxide emissions of the United States accounted for 22% of the global emissions and the (unequally shared) national wealth is literally build on free use of the atmosphere as CO2 dump. Nevertheless the United States persistently oppose attempts to decide a global climate agreement with legally binding reduction targets. According to the United States the wisest approach to reach the necessary CO2 reductions is this, quote: “We think ambition and participation will be maximized if each Party [country] can put forward a commitment it deems appropriate and fair for its circumstances …” (more about the negotiation positions of the four countries ‘here’). While the very high emissions per person of the United States slowly decrease (which is good) the global emissions increase catastrophically, due to voluntary “appropriate commitments”, growing population and lack of leadership. Planetary ‘feedback loops’ will soon voluntary take over the agenda and make the historic anthropogenic emissions look like a fuse.
In ClimatePositions the calculation of national Climate Contributions (climate debt) is “fair for its circumstances”, one might say. The table below shows the four countries’ share of the global climate debt in 2010 in comparison with a preliminary projection to 2013 (the calculation assumes that the four countries together have the same proportion of the increasing global climate debt in 2013, as in 2010).
————————————————
| . | 2010 | 2013 |
| . | . | . |
| China | 7.9% | 11.0% |
| United States | 40.7% | 36.6% |
| India | 0.0% | 0.0% |
| Russia | 2.8% | 3.7% |
————————————————
¹Open the latest spreadsheet and the fan “Territorial Emissions” (for values in CO2 multiply the values of pure carbon by 3.664).
Source of historic and preliminary carbon emissions: http://cdiac.ornl.gov/GCP/
The Carbon Dioxide Information Analysis Center (CDIAC): http://cdiac.esd.ornl.gov/
Read about carbon emissions and climate scenarios: http://robertscribbler.wordpress.com/2014/09/22/worst-case-carbon-dioxide-emissions-increases-continue-hitting-40-billion-tons-per-year-in-2013/
Read about the latest carbon emissions: http://rt.com/business/189532-china-tops-world-c02-emissions/
Comments are closed.