Climate change performance: Iran vs. Saudi Arabia (gas and oil)

2016
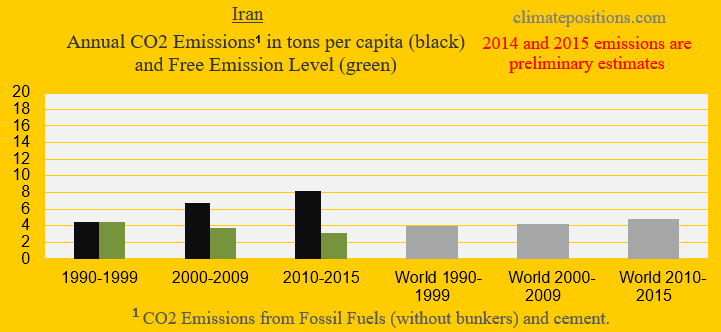
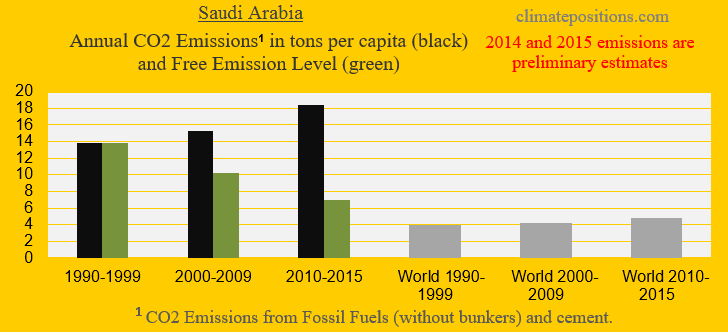
The large oil and gas producers Iran and Saudi Arabia are the world´s 7th and 8th largest emitters of CO2 from Fossil Fuels. The diagrams below show the per capita CO2 Emissions from Fossil Fuels (without bunkers) and cement, annually since 2000. The green bars show the Free Emission Level¹ – the exceedance is the basis for calculating the national Climate Debt. Iran and Saudi Arabia were responsible for 1.9% and 1.7% of global emissions in 2015.


The next two diagrams show Iran´s and Saudi Arabia´s CO2 Emissions in tons per capita, in decades. The grey bars are world emissions average. In comparison with the average CO2 Emissions in the 1990s, Iran must reduce emissions by around 38% by 2020, while Saudi Arabia must reduce by around 68%. The ‘Calculation methods‘ are identical for all 159 countries with full data in ClimatePositions.
The total primary energy supply (oil equivalent) of Iran and Saudi Arabia increased by 16% and 15% between 2010 and 2014. However, while Iran´s natural gas supplied 58% of the Fossil Fuel energy (up 3% since 2010), Saudi Arabia´s gas only supplied 30% (down 1% since 2010) – oil made up for the rest in both countries.
Iran holds the world´s largest proven reserves of natural gas and the fourth largest proven reserves of oil, while Saudi Arabia holds the second largest proven reserves of oil and the sixth largest proven reserves of natural gas. According to a ‘2015-study in the journal Nature‘, around 61% of all known extractable gas reserves in Middle East (and 49% globally) and 38% of all known oil reserves (and 33% globally) will have to stay in ground beyond 2010 if global warming are to be limited to 2°C.
Iran increased the production of natural gas by 19% between 2010 and 2014, and Saudi Arabia increased the oil production by around 26% between 2010 and 2016.
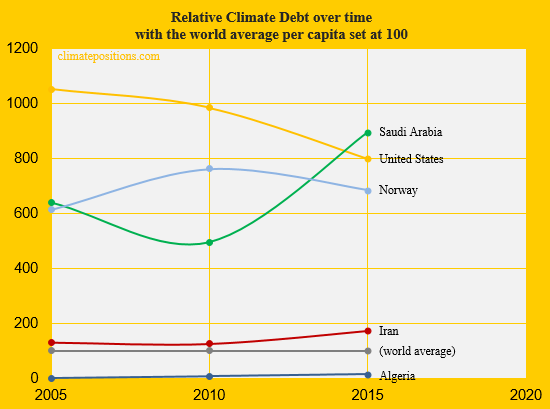
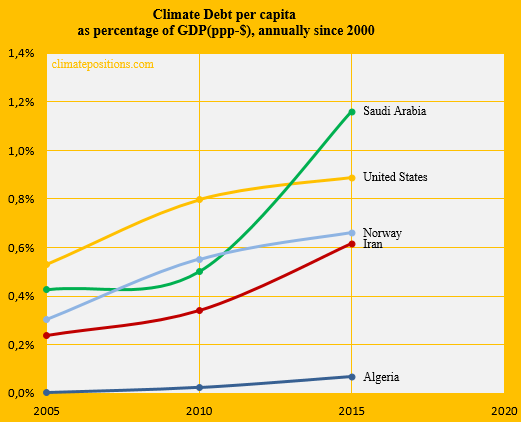
The diagram below shows the relative per capita Climate Debt of Iran and Saudi Arabia, in comparison with three other oil producers: United States, Algeria and Norway – with the world’s average Climate Debt set at 100. Iran´s current per capita Climate Debt is $1,425 and Saudi Arabia´s is $7,769 (see the latest ‘Ranking‘).
[Some figures in this article were corrected 22/5 2017]
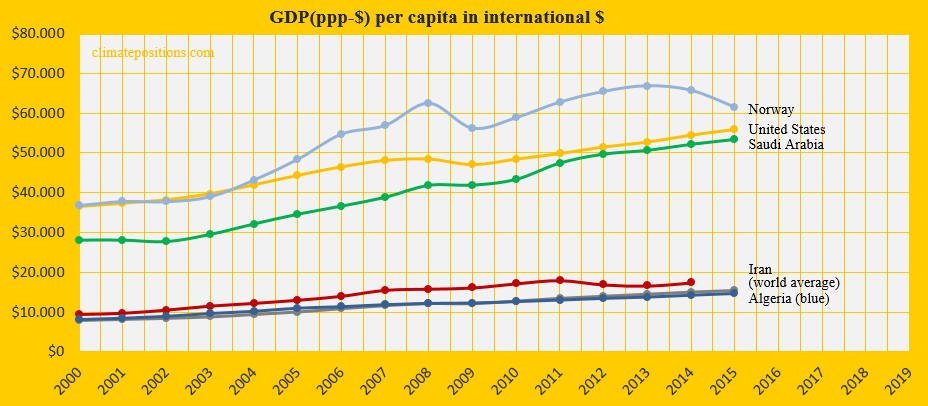
The diagram below shows the per capita GDP(ppp-$) of the same five countries and the world average. The Saudi wealth is threefold the one of Iran.
The next diagram shows Climate Debt of the five countries calculated as percentage of GDP(ppp-$), annually since 2000. See the updated ‘Ranking‘.
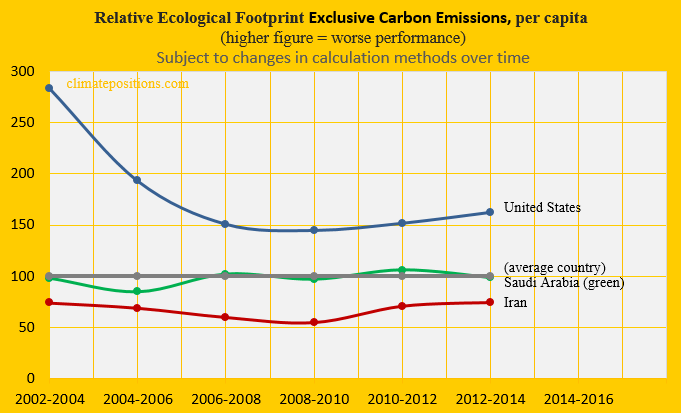
The next diagram shows the relative per capita Ecological Footprint without the carbon footprint, of Iran, Saudi Arabia and the United States, with an average country set at 100.
Finally, the table below shows four key values of the five countries, in the calculation of national Climate Debts in ClimatePositions. The price of CO2 per ton (column two) is for the total CO2 Emission from Fossil Fuels (without bunkers) and cement.
| . | Tons of CO2 | Price per | Climate change | Financing as |
| . | exceeded since | ton CO2 | financing | share of |
| . | 2000, per capita | since 2000 | per capita | Climate Debt |
| . | . | . | . | . |
| Iran | 61.40 | $12.18 | $0.00 | 0.00% |
| Saudi Arabia | 119.44 | $29.44 | $0.00 | 0.00% |
| United States | 93.01 | $22.82 | $9.03 | 0.26% |
| Algeria | 8.03 | $3.00 | $0.00 | 0.00% |
| Norway | 72.23 | $38.12 | $363.55 | 6.60% |
¹The Free Emission Level (green bars) is determined by national CO2 Emissions 1990-1999 (base), and 11 more ‘Indicators‘, of which 7 are national and 4 are global.
.
Updated data and diagrams of all ‘Indicators’ and all countries in ClimatePositions are available in the menu ‘Calculations (Excel)‘.
Data on carbon emissions (CO2 Emissions) from fossil fuels (without bunkers) and cement production are from Global Carbon Project (CDIAC); (links in the menu “Calculations”).
Data on oil and natural gas consumption and production are from: http://www.tradingeconomics.com/saudi-arabia/crude-oil-production and http://www.eia.gov/beta/international/rankings/#?prodact=26-1&cy=2014&pid=26&aid=1&tl_id=1-A&tl_type=a
Data on oil and natural gas reserves are from: https://www.cia.gov/library/publications/the-world-factbook/geos/sa.html
Information on national GDP(ppp-$) per capita: Worldbank (links in the menu “Calculations”).
Source on Ecological Footprint: Global Footprint Network (links in the menu “Calculations”).
Source on climate change financing (funding) is from Climate Funds Update (links in the menu “Calculations”).
Drawing by Claus Andersen, 2016.
Comments are closed.