Climate change performance of Israel, Lebanon and Jordan (refugees from the Syrian Civile War)
2015
The ‘Syrian Civil War’ and other violent conflicts in the region are causing huge numbers of refugees. According to ‘The UN Refugee Agency (UNHCR)’ around 1.2 million refugees lived in Lebanon by December 2014, which was 28% of the usual population. In Jordan, the percentage of refugees was 10% and in Israel 0.5%. For comparison, the world average is about 0.8% (60 million refugees globally). Under these tragic circumstances carbon dioxide emissions and Climate Debt is of cause inconsiderate to discuss, but on the other hand, manmade climate destruction also causes mass refugees, mutilation and death … with increasing force in the coming decades. Experts foresee about 200 million climate refugees by 2050, or about 2% of the projected global population of 10 billion. Or roughly speaking: Two-thirds more refugees, due to climate change alone, in a world with one-third more people – in 35 years.
Israel’s updated Climate Debt is $3,017 per capita, Lebanon’s is $457 and Jordan’s is $127. See the ‘ranking’ by November 2014. The following examines the indicators of CO2 Emissions from fossil fuels, GDP(ppp-$), relative Climate Debt over time and Climate Debt as percentage of GDP(ppp-$).
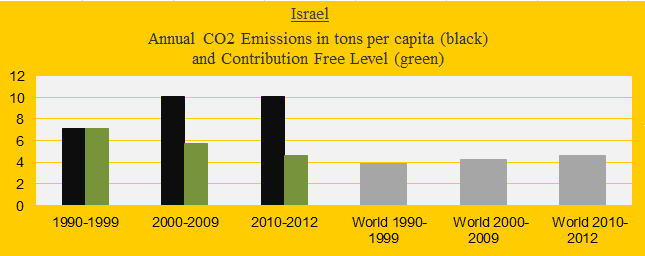
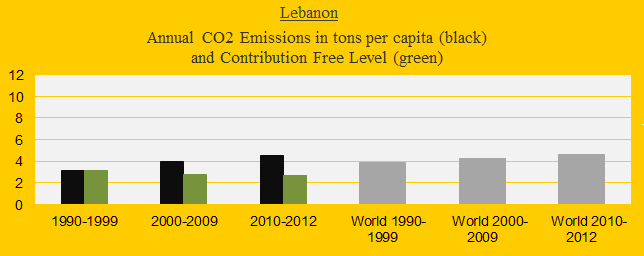
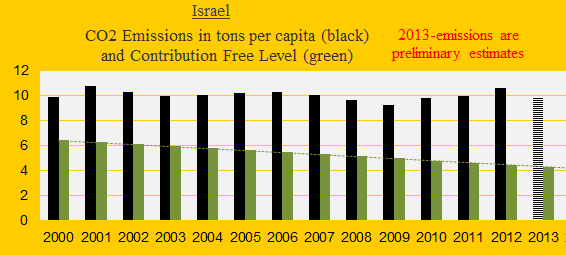
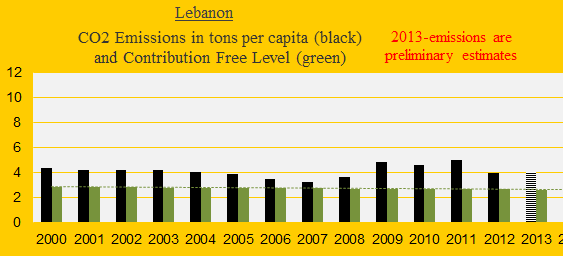
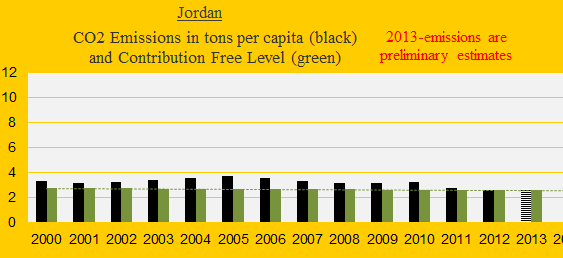
The three diagrams below show the CO2 Emissions per capita in decades of Israel, Lebanon and Jordan in comparison with the world average (the grey bars). The green bars show the Contribution Free Level in ClimatePositions – the free level is calculated on the basis of the level of CO2 Emissions in 1990s and a number of continuously updated ‘indicators’. If the black bars exceed the green, on average, then the country has a Climate Debt. The Israeli performance is miserable.
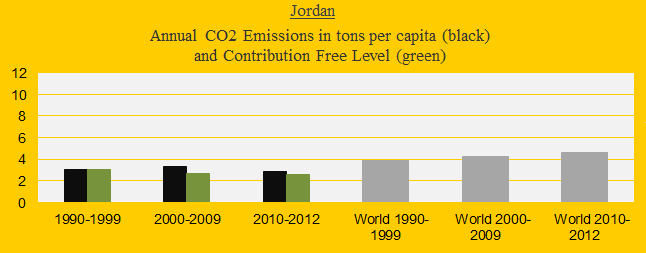
The next three diagrams show the CO2 Emissions per capita 2000-2013 (2013-emissions are preliminary estimates). Jordan’s emissions have been acceptable recently.
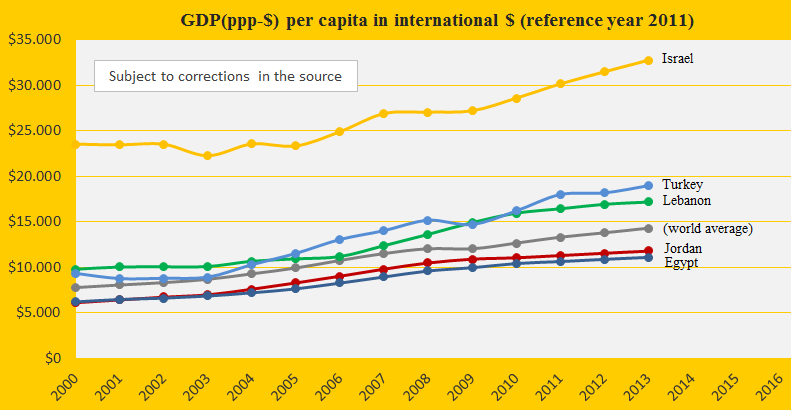
The GDP(ppp-$) per capita since 2000 of Israel, Lebanon, Jordan, Turkey, Egypt and the world average is shown in the diagram below. Israel is by far the wealthiest.
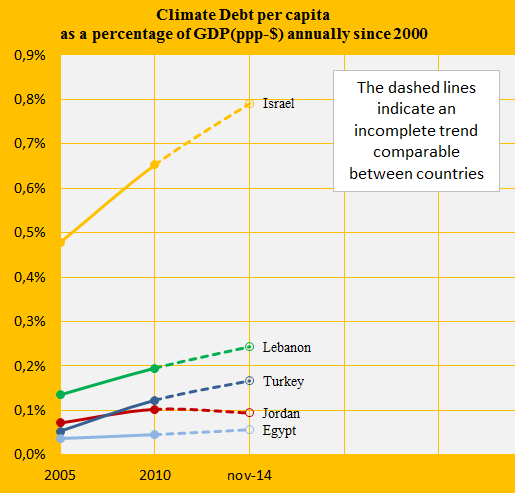
The Climate Debt calculated as percentages of the GDP(ppp-$) annually since 2000, of the same five countries, are shown in the diagram below. Again Israel stands out negatively. See the ‘ranking’.
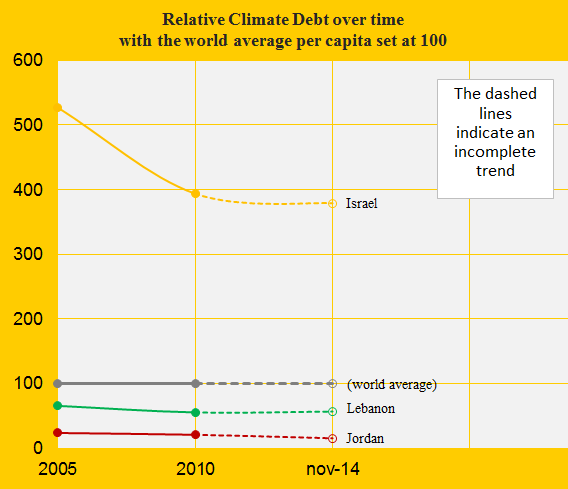
The diagram below shows the accumulated Climate Debt per capita since 2005 of Israel, Lebanon and Jordan, with the world average set at 100.
.
Information on national GDP(ppp-$) per capita: Worldbank (links in the menu “Calculations”).
Source on CO2 Emissions: EIA, U.S. Energy Information Administration and data on preliminary national CO2 Emissions are from Global Carbon Project (links in the menu “Calculations”).
About refugees: ‘The UN Refugee Agency (UNHCR)’ (with information on ‘Israel‘, ‘Lebanon‘ and ‘Jordan‘).
Drawing by Claus Andersen, 2015.
Comments are closed.