Climate change performance of Libya, Algeria, Tunisia and Morocco (refugees and the European Union)
2015
A devilish combination of poverty, armed conflict and violence in parts of Africa and Middle East, sends flows of refugees in boats across the Mediterranean Sea to Europe via Spain, Italy, Malta and Greece. In 2014 around 150,000 survived the dangerous trip to Italy alone. However, the European Union (EU) offers (as it seems) only a total of 5,000 resettlement places across Europe and the vast majority of all refugees will be sent back as irregular migrants. Read this ‘article’ from The Guardian.
In ClimatePositions 12% of the world’s population live in 36 African countries without any Climate Debt. Conversely, EU is responsible for 13% of the global Climate Debt, or $675 billion in 2013. If EUs Climate Debt were to be paid evenly to the 840 million people in the 36 African countries (which of cause would be stupid!), then each person would get more than $800, or more than one year of income for an average person in Liberia. EU’s prosperity is literally built on free CO2 Emissions from the burning of fossil fuels and the corresponding destruction of the global climate. Brutal trade barriers aimed at e.g. Africa reassure that the historical inequality is maintained. However, people around Africa have televisions, internet and mobile phones – knowledge sharing, climate change and absolute hopelessness will expectedly cause many more refugees heading for EU in the future. According to ‘The UN Refugee Agency (UNHCR)’ close to 500,000 refugees or IDPs (internally displaced persons) were locaded in Libya, Algeria, Tunisia and Morocco, in December 2014. The same four countries are transits for most boat refugees.
CO2 Emissions, climate change and Climate Debt is of cause inappropriate to discuss under these tragic circumstances, but I do so anyway because everything is linked together in a globalized world.
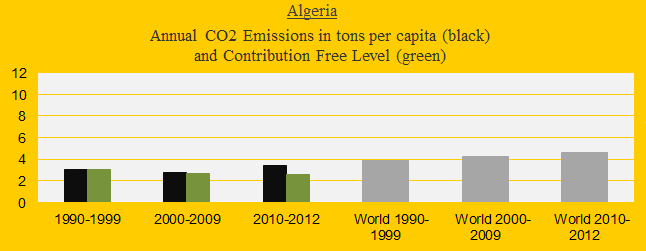
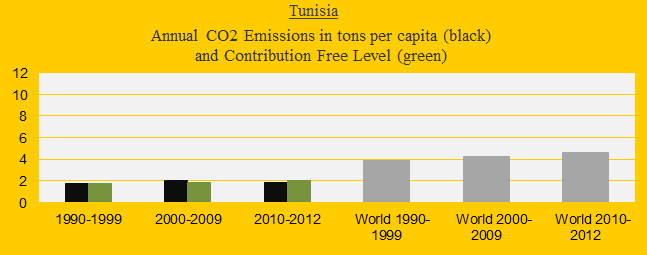
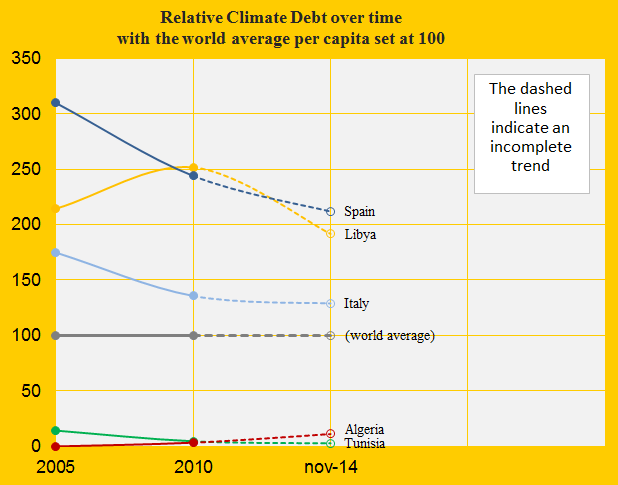
Libya’s updated Climate Debt is $1,528 per capita, Algeria’s is $91, Tunisia’s is $25 and Morocco is Contribution Free (no Climate Debt). See the ‘ranking’ by November 2014. The following examines the indicators of CO2 Emissions from fossil fuels, relative Climate Debt over time and GDP(ppp-$).
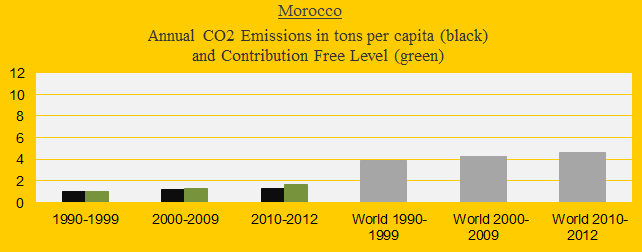
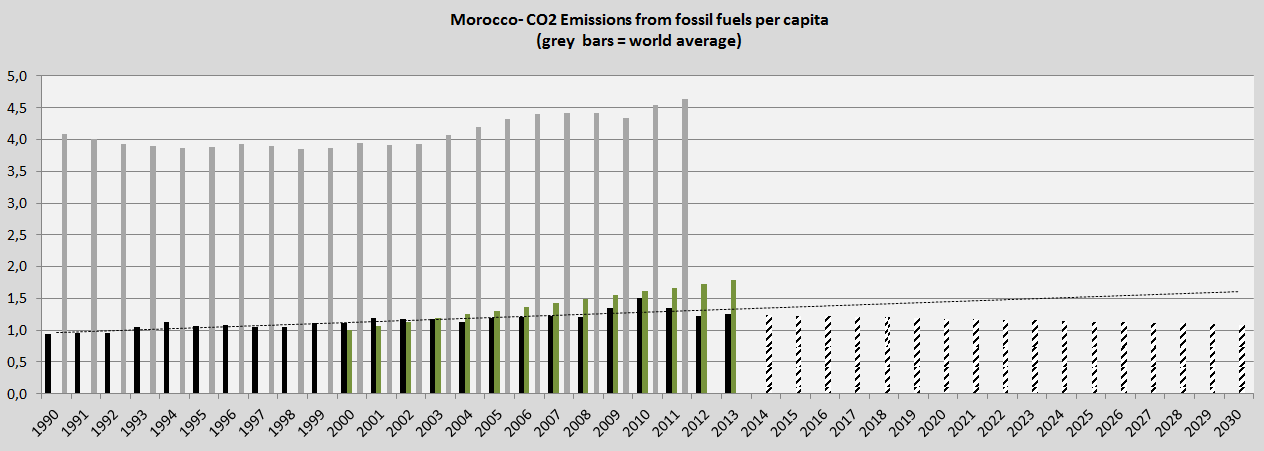
The four diagrams below show the CO2 Emissions per capita in decades of Libya, Algeria, Tunisia and Morocco in comparison with the world average (the grey bars). The green bars show the Contribution Free Level in ClimatePositions – the free level is calculated on the basis of the level of CO2 Emissions in 1990s and a number of continuously updated ‘indicators’. If the black bars exceed the green, on average, then the country has a Climate Debt.
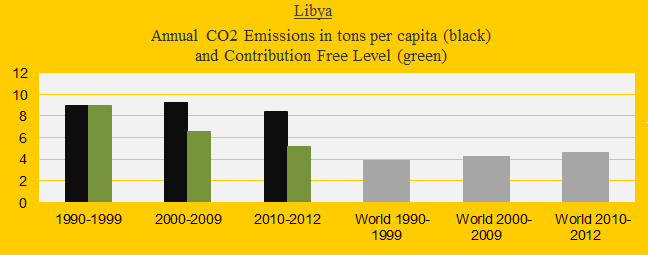
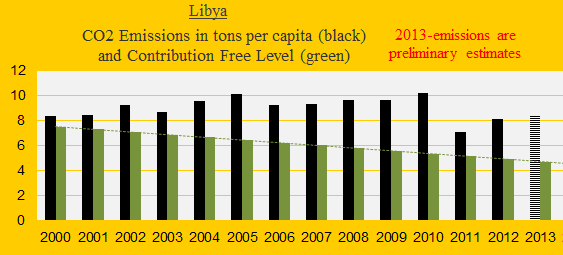
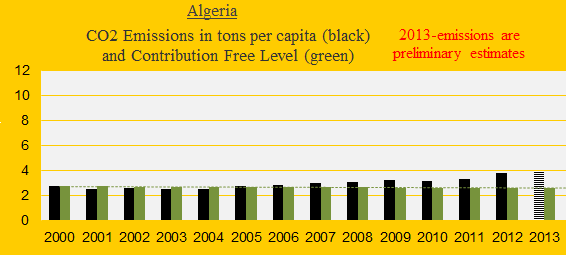
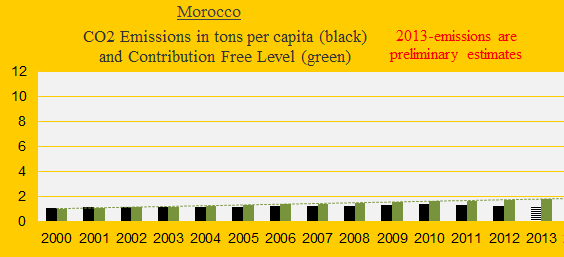
The next four diagrams show the CO2 Emissions per capita 2000-2013 (2013-emissions are preliminary estimates). The Libyan Civil War, also referred to as the Libyan Revolution, in 2011, is clearly reflected in the CO2 Emissions – the Second Libyan Civil War, starting in 2014, is still going on.
Tunisia is on the track to become Contribution Free before the end of the decade. Only Morocco is below the Contribution Free Level. Morocco’s COP Submission from 2015 is examined at the bottom.

The diagram below shows the accumulated Climate Debt per capita since 2005 of Libya, Algeria, Tunisia, Italy and Spain, with the world average set at 100. The impact of the Libyan Civil War (2011) is apparent.
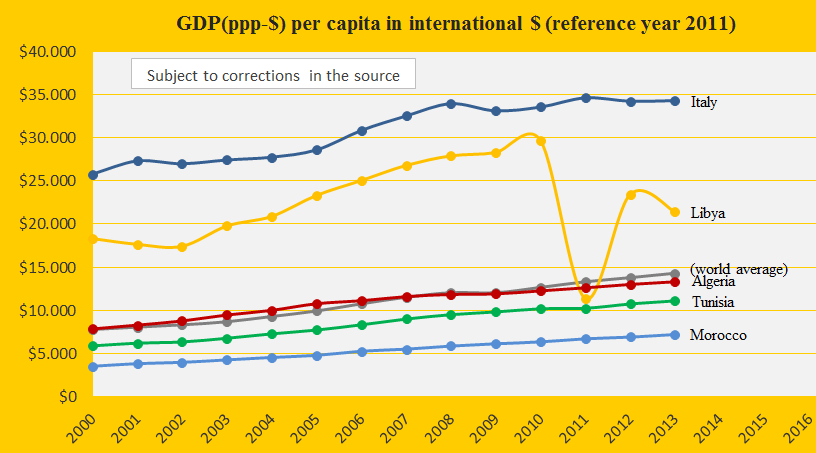
The GDP(ppp-$) per capita since 2000 of Libya, Algeria, Tunisia, Morocco, Italy and the world average is shown in the diagram below. Morocco is by far the poorest.
The “intended nationally determined contribution” in ‘Morocco’s COP Submission’ by June 2015, is to reduce greenhouse gas emissions by 32% by 2030 compared to “business as usual” projected emissions. The diagram below shows CO2 Emissions from fossil fuels per capita of the following. Read the comments below the diagram.
- Morocco’s emissions 1990-2013 (black bars).
- Business as usual projected emissions by 2030 (dashed line).
- 32% reductions by 2030, compared to business as usual (striped lines).
- The Contribution Free level in ClimatePositions (green bars)
- World’s average emissions (grey bars).
Morocco’s intended greenhouse gas reduction by 2030 is very ambitious considering that the country is not responsible for the destruction of the climate. In contrast, ClimatePositions allow a moderate increase towards a global CO2 Emission target in the future (see this ‘illustration’). The overall idea is that poor countries like Morocco are entitled to a fair level of CO2 Emissions from fossil fuels, allowing the economy to grow.
.
Information on national GDP(ppp-$) per capita: Worldbank (links in the menu “Calculations”).
Source on CO2 Emissions: EIA, U.S. Energy Information Administration and data on preliminary national CO2 Emissions are from Global Carbon Project (links in the menu “Calculations”).
COP Submissions: ‘http://www4.unfccc.int/submissions/indc/Submission%20Pages/submissions.aspx‘.
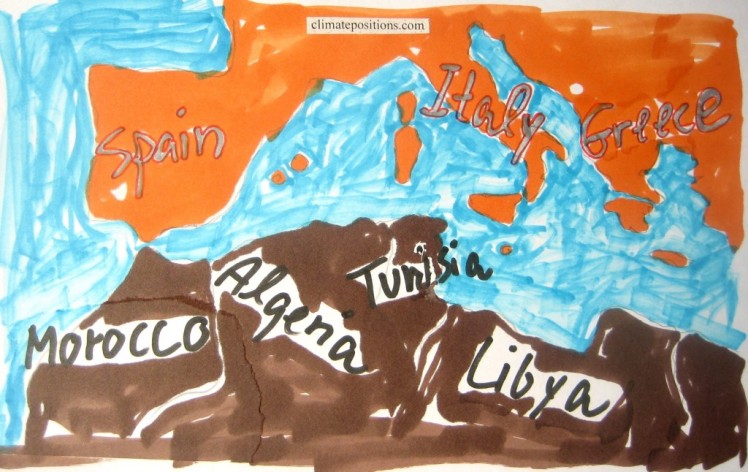
Drawing by Claus Andersen, 2015.
Comments are closed.