Climate change performance of Russia (compared to other BRICS countries)
2014
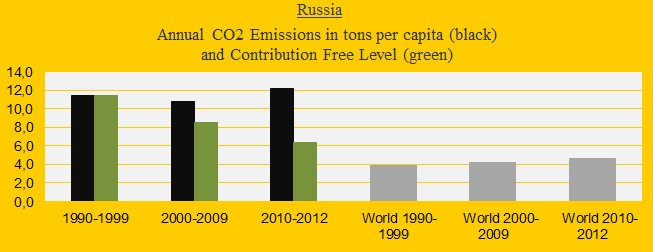
Russia was the 4th largest carbon dioxide emitter in 2012 with 5.6% of the global emissions, after China (26.9%), the United States (16.6%) and India (5.8%). The first diagram shows Russia’s CO2 Emissions per capita in decades in comparison with the world average (the green bars are the Contribution Free Level). After the COP summit in 2009 (at which China and the United States rejected a globally binding reduction agreement) the Russian emissions have increased dramatically and today the Russian Climate Contribution (climate debt) is $1,410 per capita (ranked 28th), compared to $627 in 2010 (ranked 32nd). See the ‘ranking’. The following analyzes the development in Putin’s Russia since 2000 in comparison with the other ‘BRICS‘ countries China, India, Brazil and South Africa – jointly emitting 41% of global carbon dioxide in 2012.
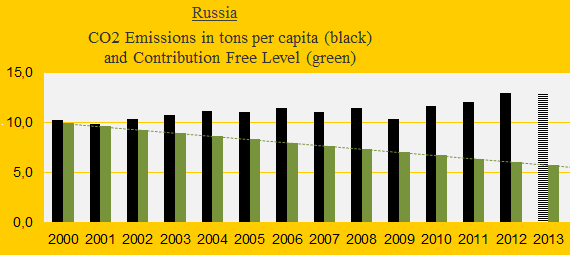
The diagram below shows Russia’s CO2 Emissions annually since 2000 (the green bars are the Contribution Free Level). The last three years of emissions are record high for twenty years. The 2013-emissions are preliminary estimates.
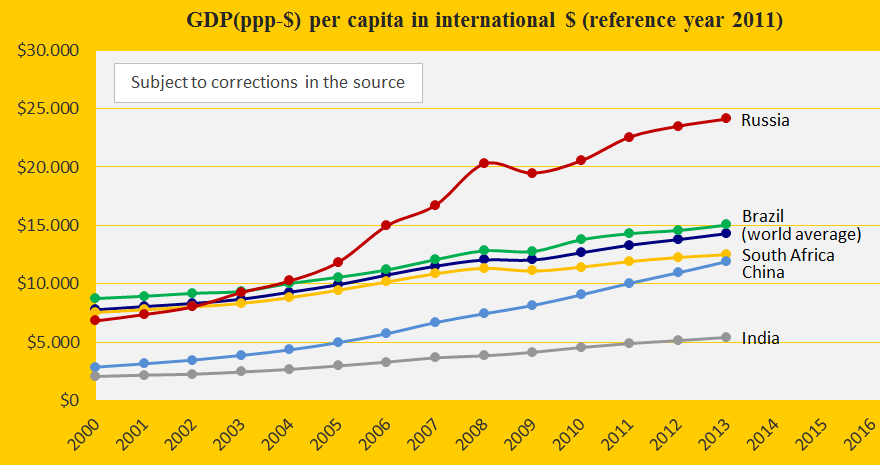
Partly because of the Russian increase of CO2 Emissions the wealth per capita has been growing fast. The diagram below shows the GDP(ppp-$) per capita in comparison with China, India, Brazil, South Africa and the world average. One can hope that the international response to Putin’s illegal annexation of Crimea in Ukraine will dampen Russia’s economy and thus the irresponsible CO2 Emissions.
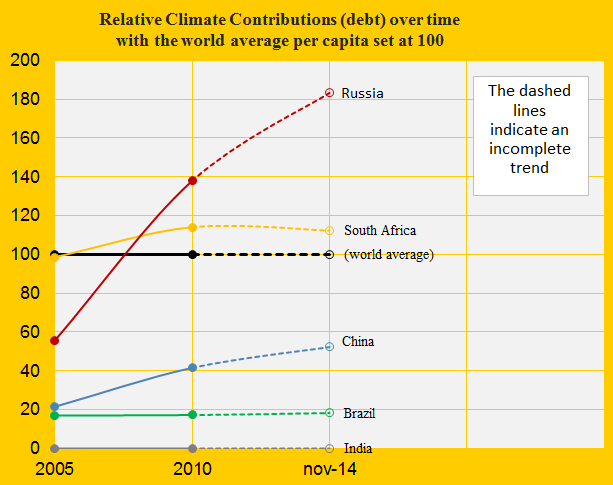
Even in comparison with other growing economies the Russian climate debt is running wild. The diagram below shows the Climate Contribution of the five BRICS countries, since 2005, with the world average set at 100.
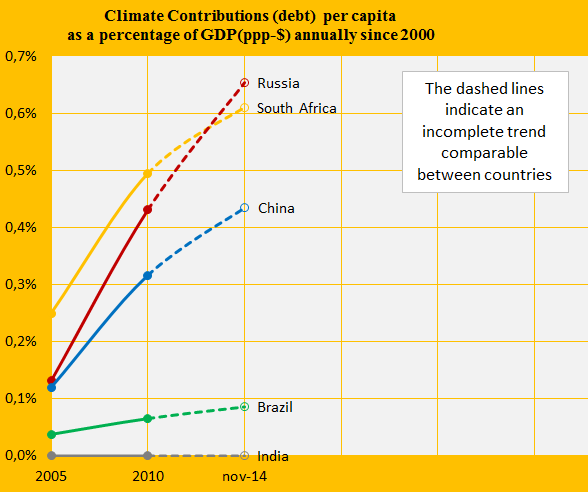
The Climate Contributions calculated as an annual percentage of the GDP(ppp-$) are shown in the diagram below. Again Russia has performed by far the worst of the five countries. See the ‘ranking’. Read about all the indicators which determine the Contribution Free Level and thus the Climate Contribution ‘here‘.
.
The highly biodiverse Primary Forests in Russia has remained at 15% of the total area between 2000 and 2010. A hypothetical example: If Russia had increased the Primary Forests to 25% in 2010 (without changing the total Forest Cover of around 49%), then the updated climate debt would have been $1,034 per capita instead of $1,410.
Information on national GDP(ppp-$) per capita: Worldbank (links in the menu “Calculations”). Read about GDP+ in the submenu ”Indicators”.
Source on CO2 Emissions: EIA, U.S. Energy Information Administration and data on preliminary national CO2 Emissions are from Global Carbon Project (links in the menu “Calculations”).
Sources on national Forest Cover and Primary Forest: United Nations (UN) (links in the menu “Calculations”).
Comments are closed.