Climate change performance of Slovakia, Poland, Hungary, Belarus and Ukraine

2015
1.5% of the global population lives in Slovakia, Poland, Hungary, Belarus or Ukraine and together they emitted 2.3% of the global CO2 from fossil fuels in 2012 – the joint share of the global Climate Debt was 0.7%.
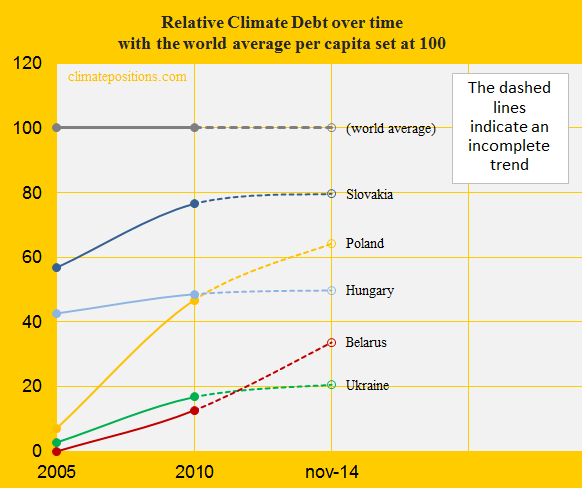
Slovakia’s accumulated Climate Debt per capita is now $640 (in 2014 the ranking was 43rd among 147 countries), Poland’s is $519 (ranked 47th), Hungary’s is $406 (ranked 54th), Belarus’ is $274 (ranked 59th) and Ukraine’s is $168 (ranked 63rd). See the ‘ranking’. The following examines the Climate Debt trends and the indicators of CO2 Emissions from fossil fuels, GDP(ppp-$) and Climate Debt as a percentage of GDP.
The first diagram (below) shows the relative Climate Debt per capita of Slovakia, Poland, Hungary, Belarus and Ukraine, with the world average set at 100. Slovakia, Hungary and Ukraine have slowed down the rates of increase, while Poland and especially Belarus have not.
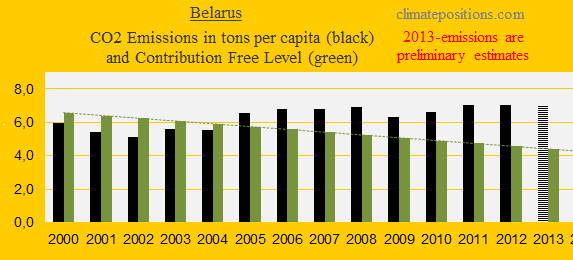
The five next diagrams show the CO2 Emissions per capita in decades in comparison with the world average (the grey bars). The green bars show the Contribution Free Level in ClimatePositions – the free level is determined by the level of CO2 Emissions in 1990s and a number of continuously updated ‘indicators‘. As a result, the black and green bars always balance in the 1990s.
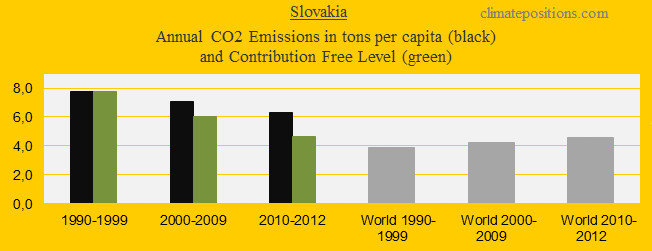
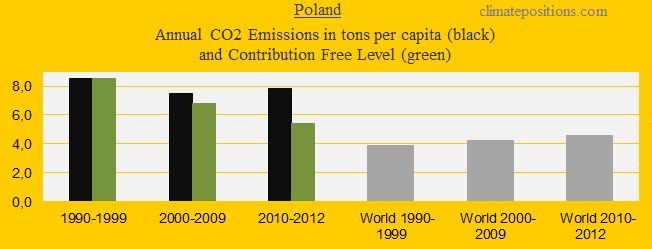
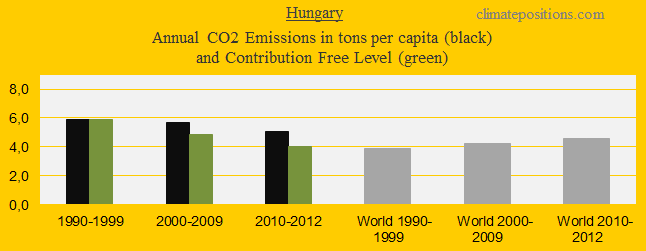

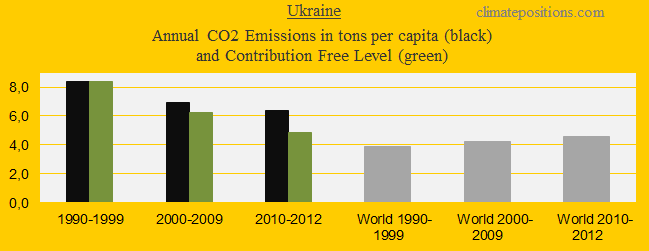
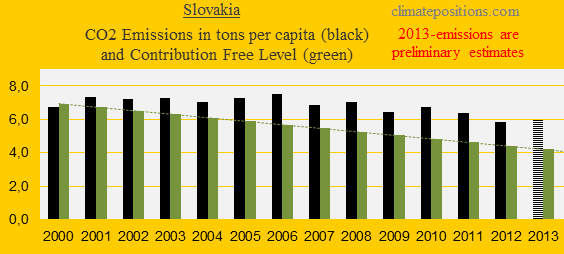
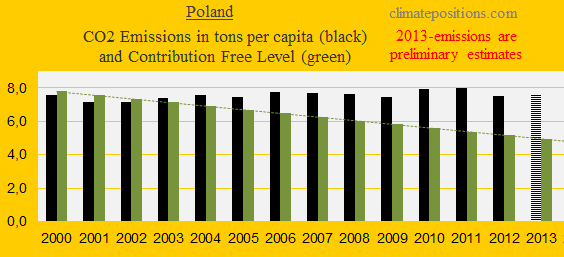
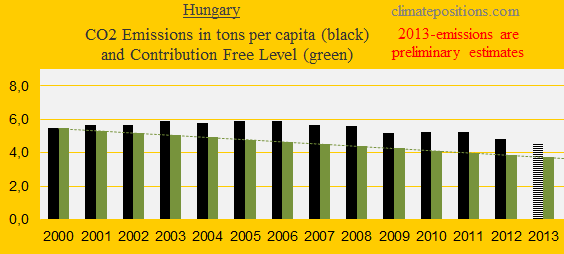
The next five diagrams show the CO2 Emissions per capita 2000-2013 (2013-emissions are preliminary estimates). The total amounts of CO2 Emissions exceeded per capita since 2000 are: Slovakia 17.7 tons, Poland 16.7, Hungary 12.2 tons, Belarus 11.9 tons and Ukraine 13.4 tons. The exceeded CO2 Emissions and the GDP(ppp) is the foundation of the calculation of national Climate Debts.

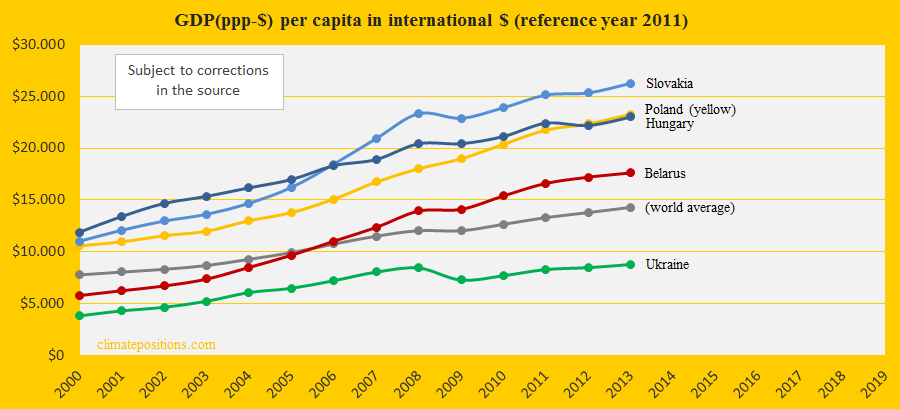
The GDP(ppp-$) per capita since 2000 of the five countries and the world average, is shown in the diagram below. The Ukrainian decline has grown into a devastating ‘crisis‘ starting in 2013.
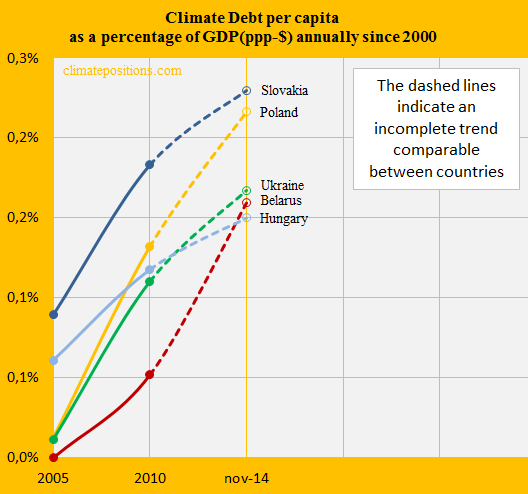
The Climate Debt calculated as percentages of the GDP(ppp-$) annually since 2000, of the five countries, are shown in the diagram below. With this method of calculation, the Hungarian performance is superior to the others. See the ‘ranking’.
The indicators of Environmental Performance, Ecological Footprint, Nuclear Power, Forest Cover, Primary Forest and Marine Protected Area, of all countries are available in the menu ‘Calculations (Excel)‘ or at the ‘sources’.
..
Information on national GDP(ppp-$) per capita: Worldbank (links in the menu “Calculations”).
Source on CO2 Emissions: EIA, U.S. Energy Information Administration and data on preliminary national CO2 Emissions are from Global Carbon Project (links in the menu “Calculations”).
Drawing by Claus Andersen, 2015.
Comments are closed.