Climate change performance of Turkmenistan, Kazakhstan and Uzbekistan
2014
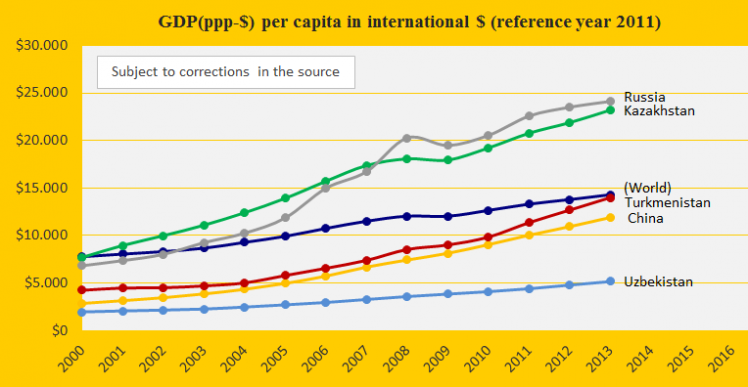
The three authoritarian regimes Turkmenistan, Kazakhstan and Uzbekistan were ranked respectively 31st, 40th and 71st on the worst performing list in ClimatePositions 2010. Their updated Climate Contributions (climate debt) are $1,043, $797 and $60 per capita. See the ranking ‘here’. The first diagram shows the GDP(ppp-$) per capita of the three neighboring countries located in the region Eurasia where the Middle East, Asia and Europe meet, in comparison with China, Russia and the world average.
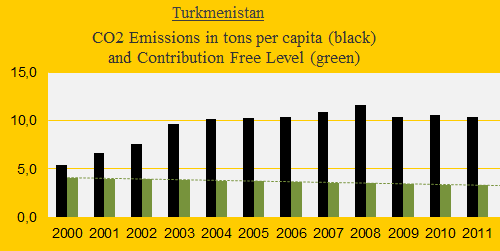
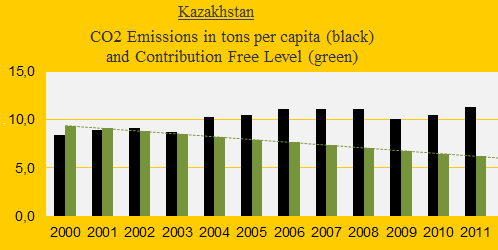
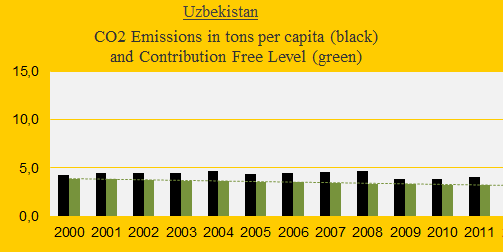
The three diagrams below show the CO2 Emissions (carbon dioxide) per capita since 2000 of Turkmenistan, Kazakhstan and Uzbekistan. The green dashed lines show the Contribution Free Level, which is determined by the national CO2 Emission level in the 1990s and six updated indicator values (read more ‘here’). The Turkmen CO2 Emissions have increased from 4.8 tons per capita in 1990s to 10.4 in 2011. The corresponding emissions of Kazakhstan were 11.0 tons in 1990s and 11.3 tons in 2011 and of Uzbekistan 4.5 tons in 1990s and 4.1 tons in 2011. The climate change performance is clearly disastrous in Turkmenistan, extremely poor in Kazakhstan and close to acceptable in Uzbekistan.
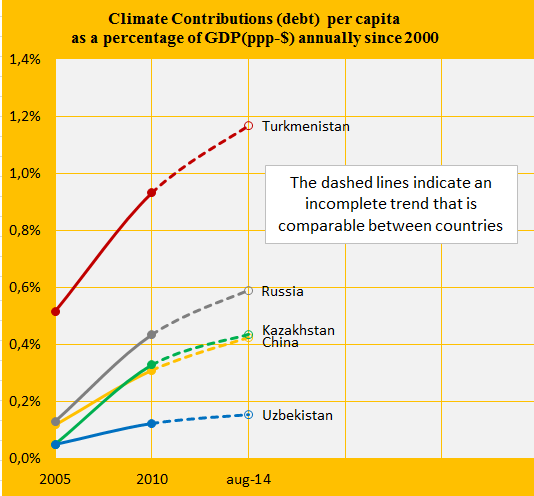
The final diagram (below) shows the countries’ Climate Contribution (climate debt) as a percentage of the national GDP(ppp-$) annually since the starting year 2000. China and Russia are included for comparison. Note that the dashed lines are incomplete trends towards the final calculation of the data year 2015. Calculated in this manner Turkmenistan is the 9th worst performing country among 145 (see the rankings ‘here’).
The table below identifies some important fossil fuel statistics of the three countries. Two-thirds of the Turkmen natural gas goes through the Russian Gazprom and the gas production is essential for the national economy. The Turkmen climate change position illustrates by this absurd 2003-legislation: Car drivers are entitled to 120 liters of free fuel a month, drivers of buses, lorries and tractors 200 liters and motorcyclists and scooter riders 40 liters (source: ‘Wikipedia‘). China is expected to become the largest buyer of natural gas from Turkmenistan in the future as a pipeline linking the two countries, through Uzbekistan and Kazakhstan, reaches full capacity.
———————————————————————
| Proven reserves, ranking | Oil | Natural gas | Coal | Population |
| . | . | . | . | . |
| Turkmenistan | 47 | 4 | ÷ | 117 |
| Kazakhstan | 11 | 14 | 8 | 62 |
| Uzbekistan | 48 | 18 | ÷ | 41 |
———————————————————————
The shrinking of the ‘Aral Sea’ surrounded by Kazakhstan and Uzbekistan is said to be one of the planet’s worst environmental disasters. The lake was formerly one of the four largest in the world but since the 1960s, after the rivers that fed it were diverted by Soviet irrigation projects, it has been steadily shrinking. By 2007, it was only about 10% of its original size, splitting into four lakes.
A hypothetical example: If Kazakhstan and Uzbekistan paid their Climate Contributions (debt) of $12.3 billion and $1.7 billion to a Global Climate Fund – and Turkmenistan, Russia and China did the same, then the fund would contain $598 billion for climate- and environmental projects, such as an Aral Sea recovery project.
.
Information on national GDP(ppp-$) per capita: Worldbank (links in the menu “Calculations”).
Source on CO2 Emissions: EIA, U.S. Energy Information Administration (links in the menu “Calculations”).
Generel information from Wikipedia: ‘Turkmenistan‘, ‘Kazakhstan‘ and ‘Uzbekistan‘.
Comments are closed.