Climate change performance: Thailand vs. France

2017
Thailand and France are the world’s 19th and 20th largest emitters of CO2 from Fossil Fuels and cement. Combined, the two countries were responsible for 1.8% of world CO2 Emissions in 2015. The following examines the ‘Indicators‘ of CO2 Emissions, GDP(ppp-$), Ecological Footprint, Forest Cover and Nuclear Power.
The diagrams below show the per capita CO2 Emissions from Fossil Fuel (without bunkers) and cement, since 2000. The green bars show the Free Emission Level¹ – the exceedance is the basis for calculating the national Climate Debt. 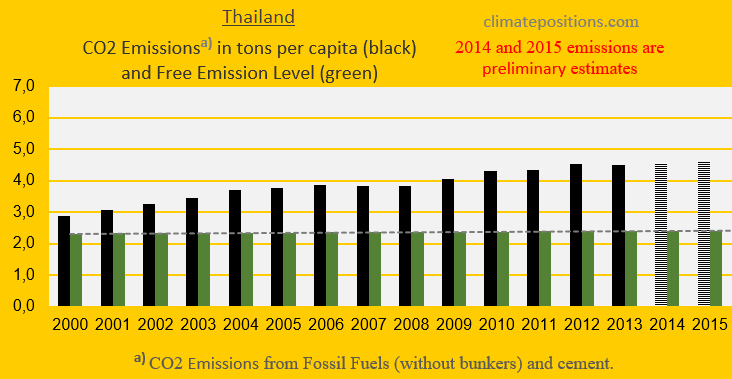

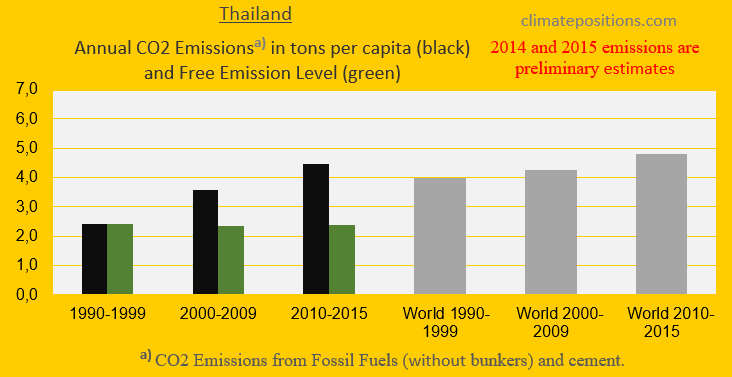
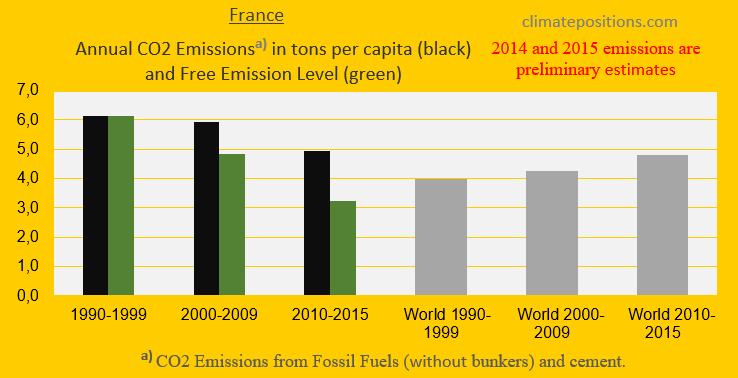
The next two diagrams show Thailand’s and France’s CO2 Emissions in tons per capita, in decades. Thailand emissions can increase by 1.4% in 2020, compared to 1990s, while France’s must reduce emissions by 68.7%. The grey bars are world emissions average.
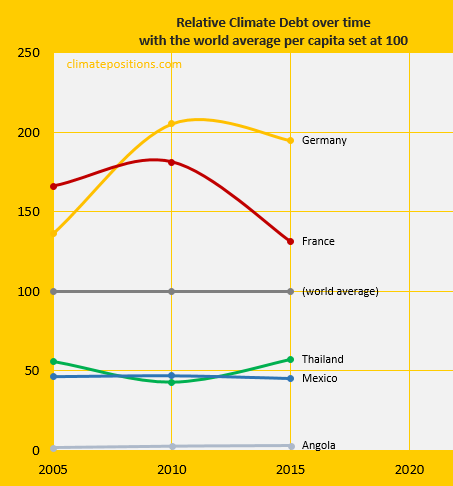
The diagram below shows the relative per capita Climate Debt of Thailand and France, in comparison with Germany, Mexico and Angola – with the world’s average Climate Debt set at 100. The current per capita Climate Debt of Thailand is $480 and the French is $1,072 (see the latest ‘Ranking‘).
[Some figures in this article were corrected 22/5 2017]
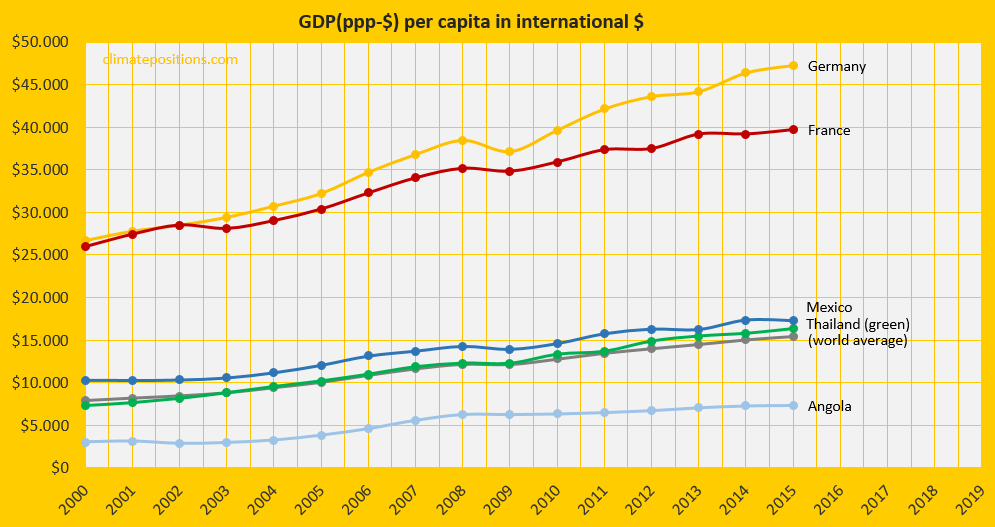
The diagram below shows the per capita GDP(ppp-$) of the same five countries and the world average. The French per capita wealth was 2.4 times the one of Thailand in 2015.
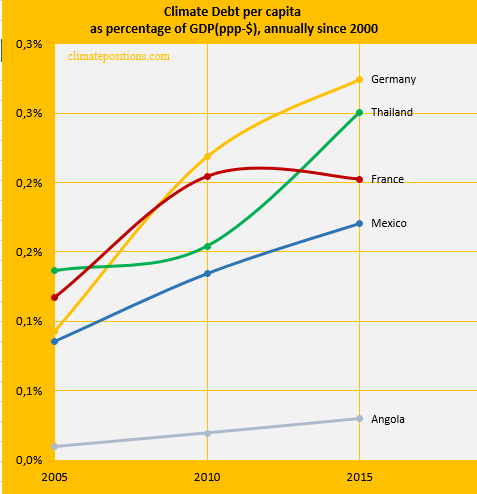
The next diagram shows Climate Debt of the five countries calculated as percentage of GDP(ppp-$), annually since 2000. See the updated ‘Ranking‘.
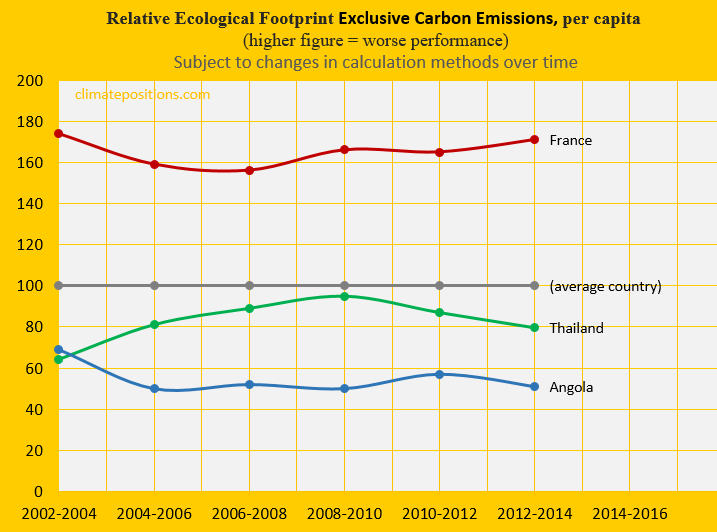
The Ecological Footprint per capita (without carbon footprint) of Thailand, France and Angola, in comparison with an average country (set at 100), is shown below. France ranked 16th among 172 countries in 2012-2014 (published 2016).
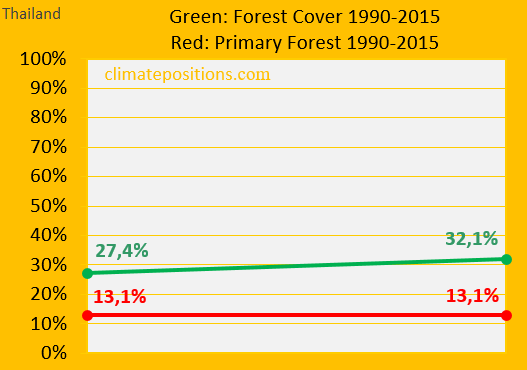
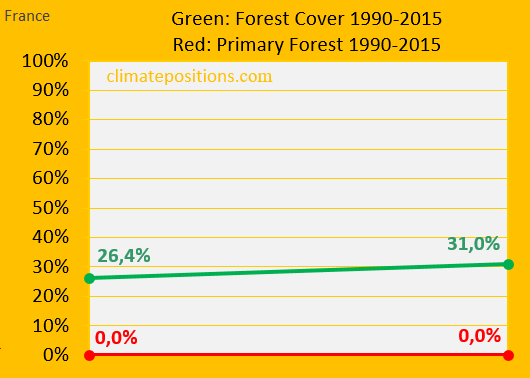
The two diagrams below show Thailand’s and France’s Forest Cover and the precious Primary Forests, as percentages of the total land area, in 1990 and 2015. The growth in Forest Cover has reduced Thailand’s per capita Climate Debt by $41 (7% reduction), while the French was reduced by $269 per capita (19% reduction).
The per capita Nuclear Power generation 2000-2015, of France and Germany, is shown below. France is the world’s largest Nuclear Power generator and 76% of the electricity is generated by Nuclear Power. Thailand has no nuclear generation, however, with “well-developed plans but commitment pending” (‘Source‘). In the calculation of Climate Debt, Nuclear Power must be phased out similar to Fossil Fuels, calculated as if Nuclear Power was oil-generated. Consequently, 45% of the current French Climate Debt is due to Nuclear Power.
![]()
Finally, the table below shows four key values of the five countries, in the calculation of national Climate Debts in ClimatePositions. The price of CO2 per ton (column two) is for total CO2 Emission from Fossil Fuels (without bunkers) and cement. Climate change financing (column three) is from March 2017.
| . | Tons of CO2 | Price per | Climate change | Financing as |
| . | exceeded since | ton CO2 | financing | share of |
| . | 2000 per capita | since 2000 | per capita | Climate Debt |
| . | . | . | . | . |
| Thailand | 24.76 | $7.67 | $0.00 | 0.00% |
| France | 21.15 | $12.31 | $22.92 | 2.14% |
| Germany | 30.77 | $11.80 | $35.23 | 2.00% |
| Mexico | 16.84 | $5.90 | $0.16 | 0.04% |
| Angola | 2.08 | $1.02 | $0.00 | 0.00% |
.
¹The Free Emission Level (green bars) is determined by national CO2 Emissions 1990-1999 (baseline), and eleven more ‘Indicators’, of which seven are national and four are global.
.
Updated data and diagrams of all ‘Indicators‘ and all countries in ClimatePositions are available in the menu ‘Calculations (Excel)’.
Data on carbon emissions (CO2 Emissions) from fossil fuels (without bunkers) and cement production are from Global Carbon Project (CDIAC); (links in the menu “Calculations / Sources and Links”).
Information on national GDP(ppp-$) per capita: Worldbank (links in the menu “Calculations / Sources and Links”).
Source on Ecological Footprint: Global Footprint Network (links in the menu “Calculations / Sources and Links”).
Data on national Nuclear Power generation: World Nuclear Association (links in the menu “Calculations / Sources and Links”).
Data on national Forest Cover and Primary Forests are from United Nations UN (Report: Global Forest Resources Assessments) (links in the menu “Calculations”).
Drawing by Claus Andersen, 2017.
Comments are closed.