Climate change performance: Turkey vs. Italy
2017
Turkey and Italy are the world’s 17th and 18th largest emitters of CO2 from Fossil Fuels and cement. Combined, the two countries were responsible for 2.0% of world CO2 Emissions in 2015. The following examines the ‘Indicators‘ of CO2 Emissions, GDP(ppp-$) and Forest Cover (including Primary Forest).
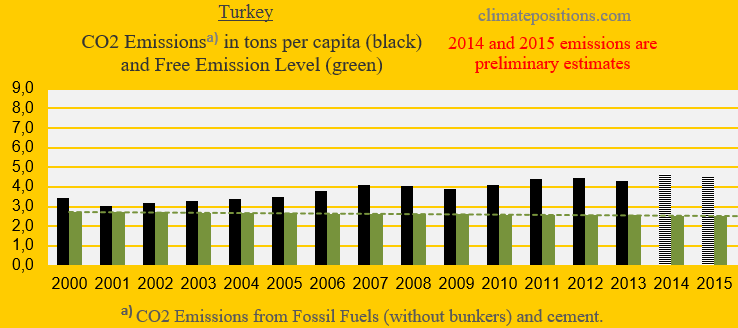
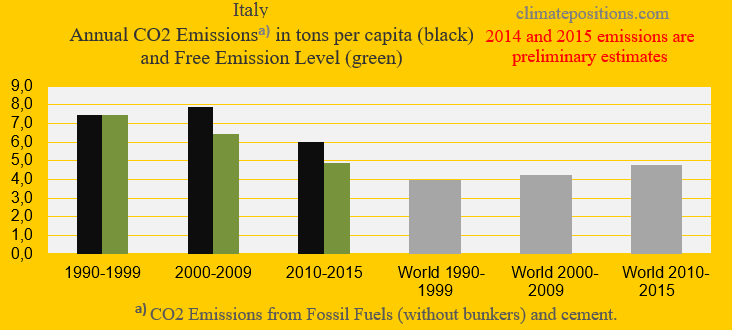
The diagrams below show the per capita CO2 Emissions from Fossil Fuel (without bunkers) and cement, since 2000. The green bars show the Free Emission Level¹ – the exceedance is the basis for calculating the national Climate Debt.
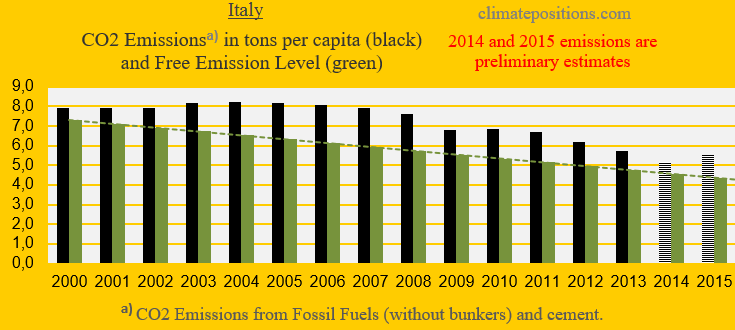
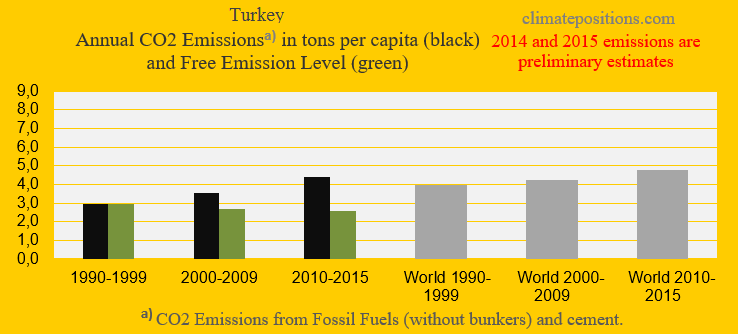
The next two diagrams show Turkey’s and Italy’s CO2 Emissions in tons per capita, in decades. Turkey must reduce emissions by 16% in 2020, compared to 1990s, while Italy must reduce by 52%. The grey bars are world emissions average. Between 2006 and 2014, Italy reduced per capita emissions by 36%.
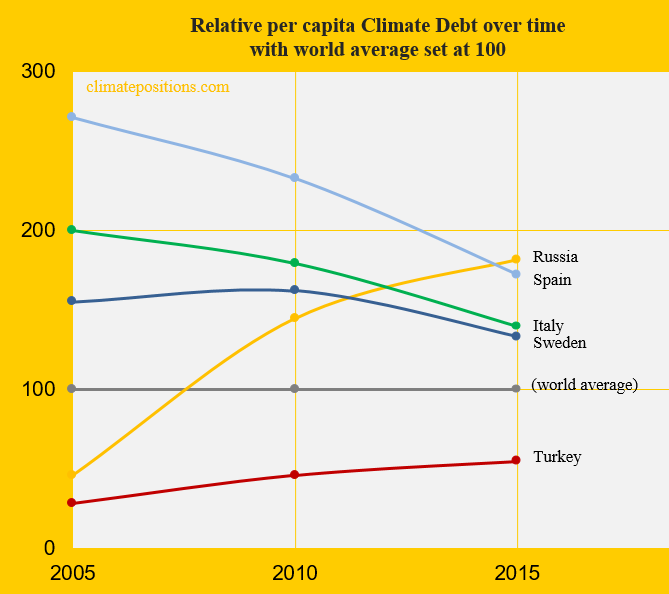
The diagram below shows the relative per capita Climate Debt of the two countries, in comparison with Russia, Spain and Sweden – with the world’s average Climate Debt set at 100. The current per capita Climate Debt of Turkey is $475 while Italy’s is $1,052 (see the latest ‘Ranking‘).
[Some figures in this article were corrected 22/5 2017]
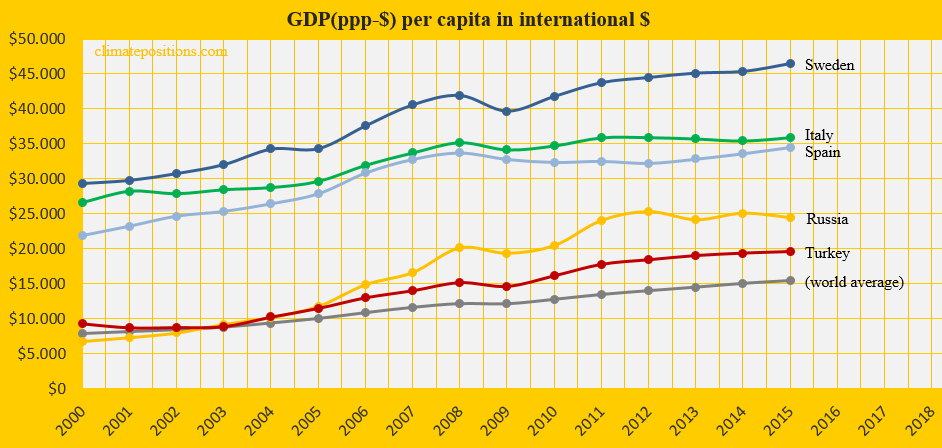
The diagram below shows the per capita GDP(ppp-$) of the same five countries and the world average. Italy was hit hard by the financial crisis in 2008 and stagnated since then.
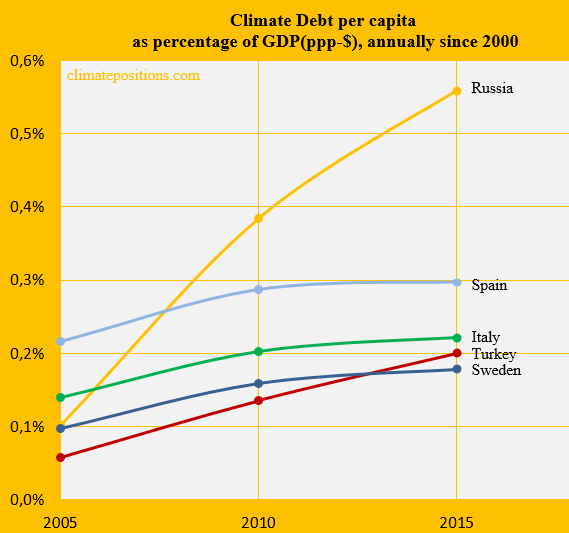
The next diagram shows Climate Debt of the five countries calculated as percentage of GDP(ppp-$), annually since 2000. See the updated ‘Ranking‘.
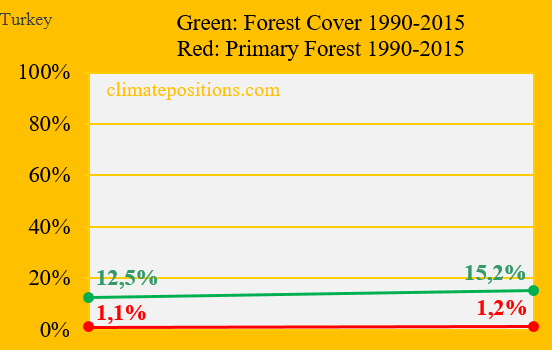
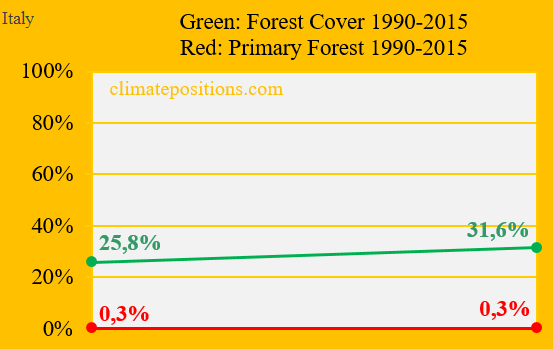
Both Turkey and Italy increased their Forest Cover between 1990 and 2015: Turkey from 12.5% (of the total land area) to 15.2%, and Italy from 25.8% to 31.6%. However, both countries performed poorly on the precious Primary Forests: Turkey increased insignificantly from 1.1% (of the total land area) in 1990 to 1.2% in 2015, while Italy remained at 0.3%.
Finally, the table below shows four key values of the five countries, in the calculation of national Climate Debts in ClimatePositions. The price of CO2 per ton (column two) is for total CO2 Emission from Fossil Fuels (without bunkers) and cement. Climate change financing (column three) is from March 2017.
| . | Tons of CO2 | Price per | Climate change | Financing as |
| . | exceeded since | ton CO2 | financing | share of |
| . | 2000, per capita | since 2000 | per capita | Climate Debt |
| . | . | . | . | . |
| Turkey | 20.08 | $7.67 | $0.03 | 0.01% |
| Italy | 21.43 | $9.19 | $2.75 | 0.26% |
| Russia | 54.80 | $8.86 | $0.01 | 0.00% |
| Sweden | 20.29 | $14.27 | $105.52 | 9.44% |
| Spain | 28.68 | $231.77 | $10.43 | 0.80% |
¹The Free Emission Level (green bars) is determined by national CO2 Emissions 1990-1999 (baseline), and eleven more ‘Indicators’, of which seven are national and four are global..
.
Updated data and diagrams of all ‘Indicators‘ and all countries in ClimatePositions are available in the menu ‘Calculations (Excel)’.
Data on carbon emissions (CO2 Emissions) from fossil fuels (without bunkers) and cement production are from Global Carbon Project (CDIAC); (links in the menu “Calculations / Sources and Links”).
Data on energy CO2 Emissions from Coal, Oil and Gas are from ‘http://www.iea.org/publications/‘ (CO2 Highlights, Excel).
Information on national GDP(ppp-$) per capita: Worldbank (links in the menu “Calculations / Sources and Links”).
Data on Forest Cover and Primary Forest are from Data on national forest cover and primary forests are from United Nations UN (Report: Global Forest Resources Assessments) (links in the menu “Calculations / Sources and Links”).
PowerPoint image by Claus Andersen, 2017.
Comments are closed.