Climate change performance: Venezuela vs. Iraq (world’s proven reserves of oil and natural gas)
2017
Venezuela holds the world’s largest proven oil reserves and the 8th largest proven natural gas reserves, while Iraq ranks 5th on oil and 12th on gas. Together, the two countries hold nearly 27% of the world’s proven reserves of oil and 5% of its natural gas.
The two tables below rank the 15 countries with the largest proven oil and natural gas reserves and their world shares. Combined, the 19 Fossil Fuel countries listed below hold 93% of the world’s proven oil reserves and 88% of the proven natural gas reserves. They represent 38% of the global population, 62% of the global CO2 Emissions from Fossil Fuels (2015) and 74% of the current global Climate Debt in ClimatePositions (the combined share of the global Climate Debt of the 15 countries has increased by 3.6% since 2012; see the ‘Ranking‘.
| . | Oil | Share |
| . | Proven reserves | of total |
| . | . | . |
| 1. | Venezuela | 17.6% |
| 2. | Saudi Arabia | 15.6% |
| 3. | Canada | 10.0% |
| 4. | Iran | 9.3% |
| 5. | Iraq | 9.0% |
| 6. | Russia | 6.4% |
| 7. | Kuwait | 5.9% |
| 8. | United Arab Emirates | 5.7% |
| 9. | Libya | 2.8% |
| 10. | United States | 2.8% |
| 11. | Nigeria | 2.2% |
| 12. | Kazakhstan | 1.8% |
| 13. | China | 1.5% |
| 14. | Qatar | 1.5% |
| 15. | Brazil | 0.7% |
| . | Natural gas | Share |
| . | Proven reserves | of total |
| . | . | . |
| 1. | Iran | 18.0% |
| 2. | Russia | 17.3% |
| 3. | Qatar | 13.0% |
| 4. | Turkmenistan | 9.4% |
| 5. | United States | 4.7% |
| 6. | Saudi Arabia | 4.5% |
| 7. | United Arab Emirates | 3.3% |
| 8. | Venezuela | 3.1% |
| 9. | China | 2.9% |
| 10. | Nigeria | 2.8% |
| 11. | Algeria | 2.4% |
| 12. | Iraq | 2.0% |
| 13. | Australia | 1.9% |
| 14. | Indonesia | 1.5% |
| 15. | Canada | 1.2% |
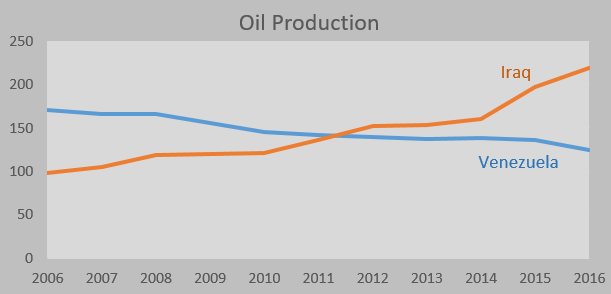
The huge Venezuelan oil reserves is “heavy” by international standards and must therefore be processed by specialized refineries. In addition, the investments have been affected by political turbulence in recent year. Consequently, the reserves do not attract much development investments and are considered more or less irrelevant. The graphs below show the Venezuelan and the Iraqi oil production in million tons annually since 2006.
Venezuela’s accumulated Climate Debt is $872 per capita, while Iraq’s is $370 (see the latest ‘Ranking‘). The two countries are the world’s 29th and 30th largest emitters of CO2 from Fossil Fuels (without bunker) and cement – combined, they emitted 1% of the global CO2 in 2015.
The diagram below shows the national shares of the global Climate Debt, in 2017 and 2012. Both countries have increased their shares in recent years.

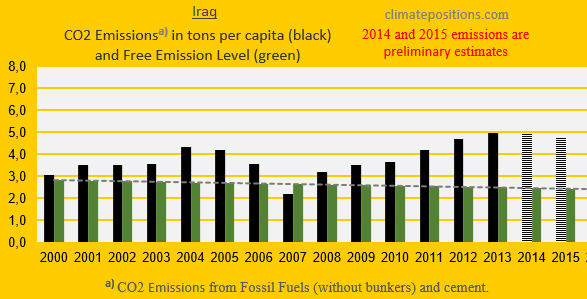
The two diagrams below show the per capita CO2 Emissions from Fossil Fuel (without bunkers) and cement, since 2000. The green bars show the Free Emission Level¹ – the exceedance is the basis for calculating the national Climate Debt.
According to ‘BP Statistical Review of World Energy June 2017‘ (pdf, page 47) Venezuela’s total CO2 Emissions from Fossil Fuels decreased by 1.8% in 2016, compared to 2015.

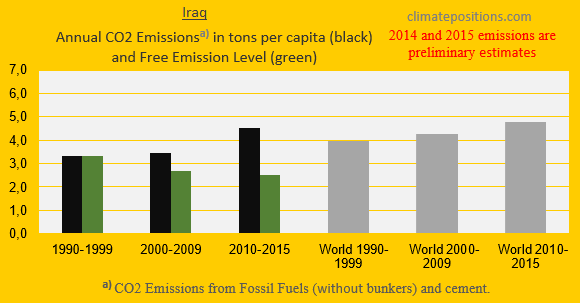
The next two diagrams show Venezuela’s and Iraq’s CO2 Emissions in tons per capita, in decades. Venezuela must reduce emissions by 54% in 2020, compared to 1990s (from 6.0 tons to 2.8 tons), while Iraq must reduce emissions by 29% (from 3.3 tons to 2.3 tons). The grey bars are world emissions average.

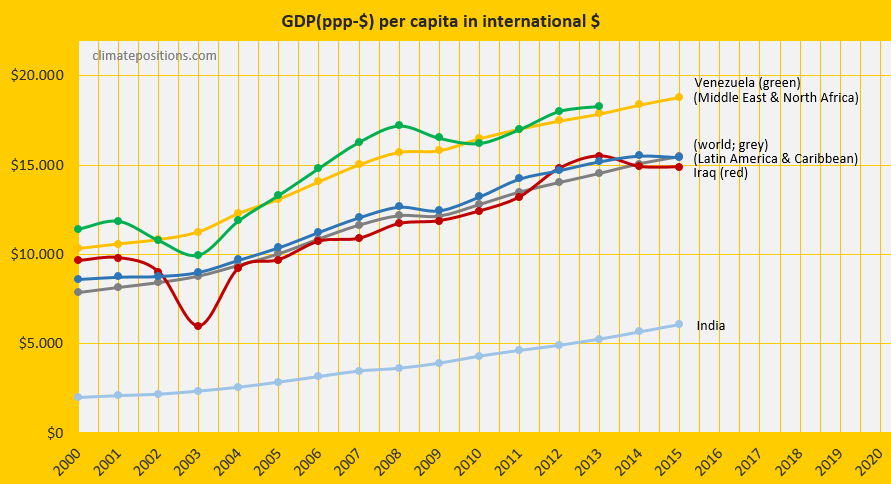
The diagram below shows the per capita GDP(ppp-$) of Venezuela (until 2013) and Iraq, in comparison with Middle East & North Africa, Latin America & Caribbean, India and World. Venezuela is wealthier than the surrounding region (note that the Venezuelan economy has been ‘Shrinking since 2013‘), while Iraq is poorer than the surrounding region.
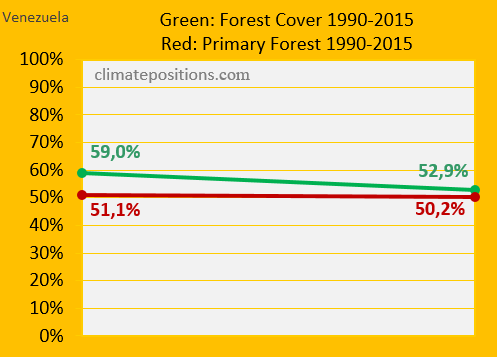
The diagram below shows the changes in Forest Cover and Primary Forests, from 1990 to 2015, of Venezuela. The precious Primary Forests are still 50.2% of the total land area, compared to 51.1% in 1990; which is remarkable for the region. Iraq’s Forest Cover is unchanged less than 2%.
Finally, the table below shows four key values of Venezuela, Iraq, Saudi Arabia, Iran, Turkey, Brazil, Guyana and Colombia, in the calculation of national Climate Debts in ClimatePositions. The price of CO2 per ton (column two) is for total CO2 Emission from Fossil Fuels (without bunkers) and cement. Climate change financing (column three) is from March 2017.
| . | Tons of CO2 | Price per | Climate change | Financing as |
| . | exceeded since | ton CO2 | financing | share of |
| . | 2000, per capita | since 2000 | per capita | Climate Debt |
| . | . | . | . | . |
| Saudi Arabia | 119.74 | $29.44 | $0.00 | 0.00% |
| Iran | 61.70 | $12.18 | $0.00 | 0.00% |
| Venezuela | 35.93 | $8.58 | $0.00 | 0.00% |
| Turkey | 20.08 | $7.67 | $0.03 | 0.01% |
| Iraq | 19.74 | $5.99 | $0.00 | 0.00% |
| Brazil | 7.44 | $4.57 | $0.03 | 0.02% |
| Guyana | 6.53 | $1.57 | $0.00 | 0.00% |
| Colombia | 0.00 | $0.00 | $0.00 | 0.00% |
.
¹The Free Emission Level (green bars) is determined by national CO2 Emissions 1990-1999 (baseline), and eleven more ‘Indicators‘, of which seven are national and four are global.
.
Updated data and diagrams of all ‘Indicators‘ and all countries in ClimatePositions are available in the menu ‘Calculations (Excel)’.
Data on carbon emissions (CO2 Emissions) from fossil fuels (without bunkers) and cement production are from Global Carbon Project (CDIAC); (links in the menu Calculations / Sources & Links).
Information on national GDP(ppp-$) per capita: Worldbank (links in the menu Calculations / Sources & Links).
Data on national Forest Cover and Primary Forests are from United Nations UN (Report: Global Forest Resources Assessments) (links in the menu Calculations / Sources & Links).
Drawing by Claus Andersen, 2017.
Comments are closed.