Climate Change Performance: Vietnam vs. United Arab Emirates (UAE)

2017
The difference in climate change performance of Vietnam and United Arab Emirates (UAE) is somewhat educational. Vietnam’s Climate Debt is $14 per capita, while the authoritarian oil state of UAEs is $10,884 (see the latest ‘Ranking‘). The two countries are the world’s 27th and 28th largest emitters of CO2 from Fossil Fuels (without bunker) and cement – combined, they emitted 0.52 % of the global CO2 in 2015. The following examines the ‘Indicators‘ of CO2 Emissions, Population, GDP(ppp-$) and Forest Cover (including Primary Forest).
First, the diagram below shows the national shares of the global Climate Debt, in 2017 and 2012. Both countries increased their shares in recent years, although at completely different levels and in unalike ways.
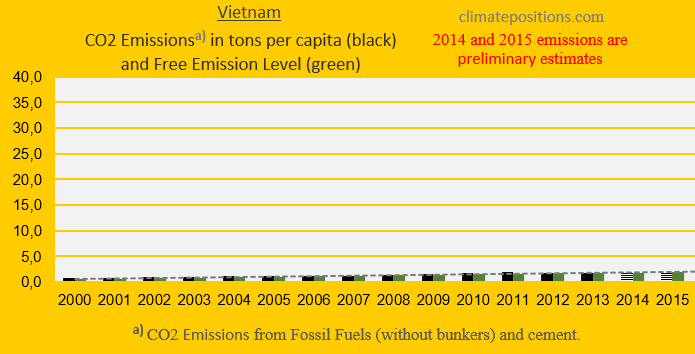
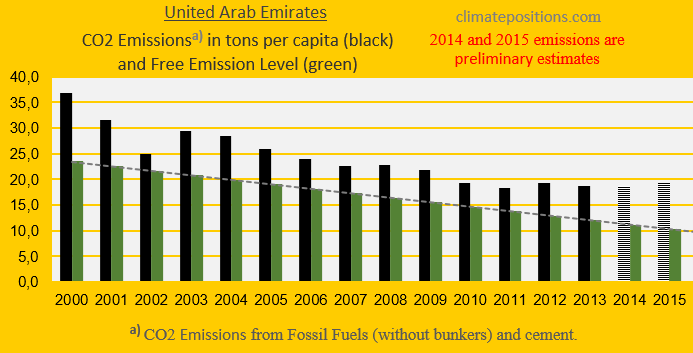
The two diagrams below show the per capita CO2 Emissions from Fossil Fuel (without bunkers) and cement, since 2000. The green bars show the Free Emission Level¹ – the exceedance is the basis for calculating the national Climate Debt.
According to ‘BP Statistical Review of World Energy June 2017‘ (pdf, page 47) UAEs total CO2 Emissions from Fossil Fuels in 2016 were 4.4% above the 2015-level, while Vietnam’s were 0.2% below. Between 2000 and 2016 UAEs emissions increased by 123%.
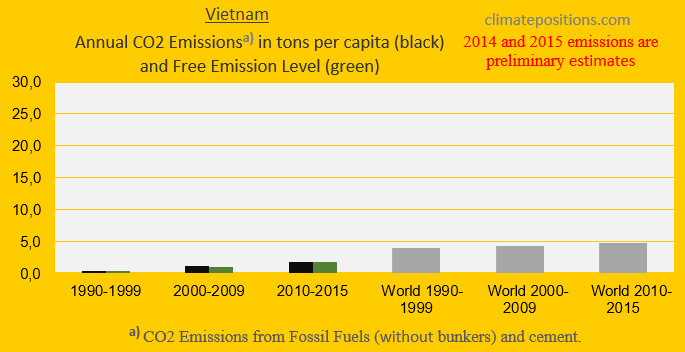
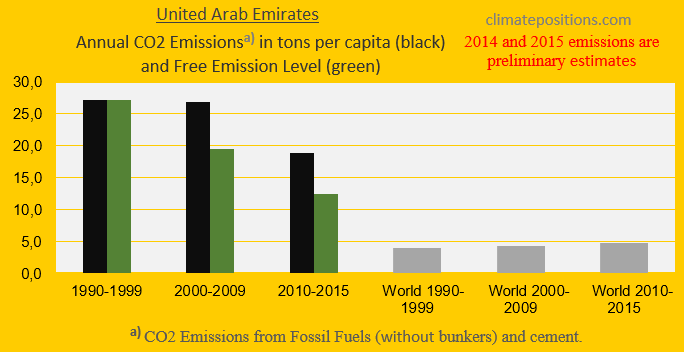
The next two diagrams show Vietnam’s and UAEs CO2 Emissions in tons per capita, in decades. Vietnam can increase emissions by 421% in 2020, compared to 1990s (from 0.4 tons to 2.3 tons), while UAE must reduce emissions by 75% (from 27.0 tons to 6.7 tons). The grey bars are world emissions average.
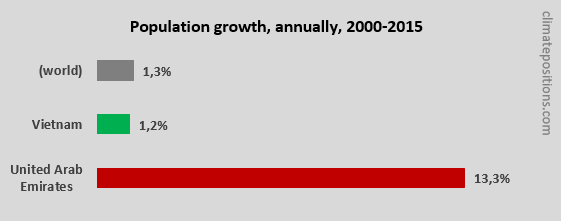
The population-growth of UAE was extreme 13.3% annually between 2000 and 2015 (see the diagram). The growth was mainly due to low-paid workforce immigration from India, Pakistan, Bangladesh, Egypt, Philippines, etc., and expatriate workers were about 90% of the workforce in 2013. The immigrants generally lack the rights associated with citizenship and face various restrictions on their rights as workers². In the context of climate change performance, the population-growth has cut national per capita CO2 Emissions – and consequently the per capita Climate Debt. Even so, UAE ranks 6th among 159 countries. One can only imagine the degree of climate destruction performed by the minority of rich and brutal native Emiratis.
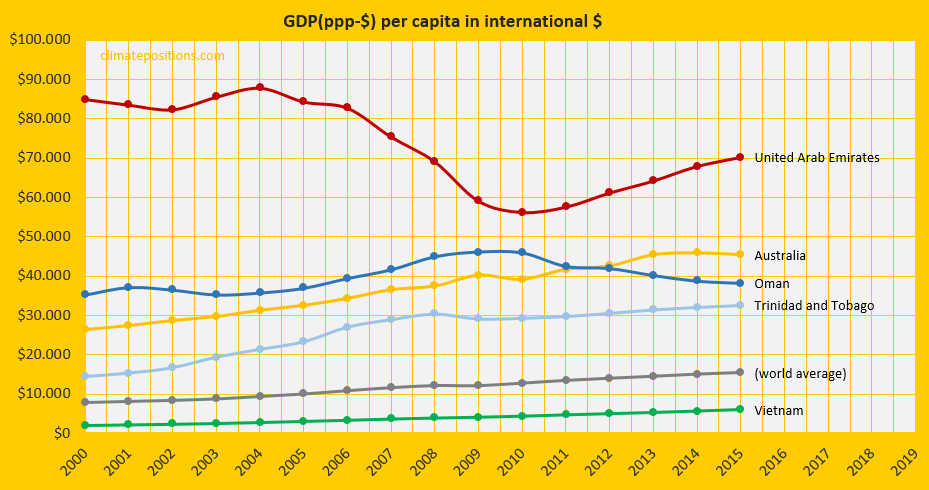
The diagram below shows the per capita GDP(ppp-$) of Vietnam, UAE, Australia, Oman, Trinidad and Tobago and world average. The wealth of UAE was twelve times the one of Vietnam, in 2015.
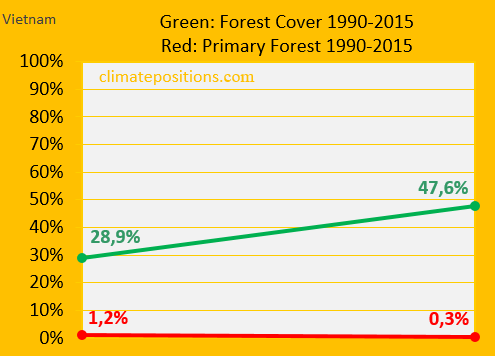
The diagram below shows the changes in Forest Cover and Primary Forests, from 1990 to 2015, of Vietnam. The Forest Cover grew impressively, while the precious Primary Forests are now nearby zero. UEA’s Forest Cover grew from 2.9% (of the land area) to 3.9% during the same period.
Finally, the table below shows four key values of the five countries, in the calculation of national Climate Debts in ClimatePositions. The price of CO2 per ton (column two) is for total CO2 Emission from Fossil Fuels (without bunkers) and cement. Climate change financing (column three) is from March 2017.
| . | Tons of CO2 | Price per | Climate change | Financing as |
| . | exceeded since | ton CO2 | financing | share of |
| . | 2000, per capita | since 2000 | per capita | Climate Debt |
| . | . | . | . | . |
| Vietnam | 2.07 | $0.62 | $0.00 | 0.00% |
| UAE | 111.80 | $28.52 | $0.00 | 0.00% |
| Australia | 105.60 | $22.49 | $19.43 | 0.32% |
| Oman | 149.32 | $38.62 | $0.00 | 0.00% |
| Trinidad and T. | 313.34 | $27.42 | $0.00 | 0.00% |
¹The Free Emission Level (green bars) is determined by national CO2 Emissions 1990-1999 (baseline), and eleven more ‘Indicators’, of which seven are national and four are global.
²’Wikipedia‘.
.
A hypothetical example: If Vietnam’s Forest Cover had been unchanged since 1990, then the per capita Climate Debt would have been $37 instead of the current $14.
.
Updated data and diagrams of all ‘Indicators’ and all countries in ClimatePositions are available in the menu ‘Calculations (Excel)‘.
Data on carbon emissions (CO2 Emissions) from fossil fuels (without bunkers) and cement production are from Global Carbon Project (CDIAC); (links in the menu Calculations / Sources & Links).
Data on national and global Populations is from Worldbank (links in the menu Calculations / Sources & Links).
Information on national GDP(ppp-$) per capita: Worldbank (links in the menu Calculations / Sources & Links).
Data on national Forest Cover and Primary Forests are from United Nations UN (Report: Global Forest Resources Assessments) (links in the menu Calculations / Sources & Links).
Drawing by Claus Andersen, 2017.
Comments are closed.