Climate Debt: Finland ranks 13th among 148 countries

Finland’s current Climate Debt is $3,078 per capita and the ‘Ranking’ by January 2016 was 13th among 148 countries, compared to 10th ranked in 2010. The following examines the Finnish CO2 Emissions, Nuclear Power, Forest Cover, Environmental Performance and GDP(ppp-$), in comparison with the four largest trade partners Russia, Germany, Sweden and United Kingdom.
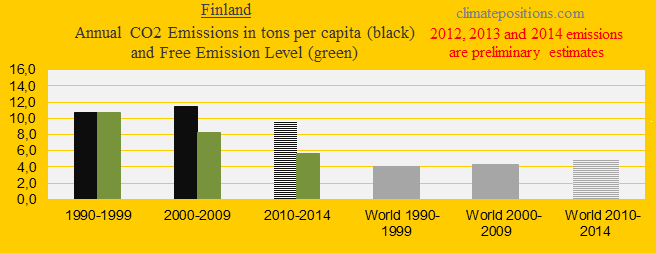
The first diagram shows Finland’s per capita CO2 Emissions from fossil fuels (without bunker fuels) and cement production in decades in comparison with the world average. CO2 Emissions since 2012 are preliminary estimates. From 10.7 tons emitted in the 1990s the level increased slightly to 10.8 tons on average between 2000 and 2014 (preliminary). The green bars are the Contribution Free Level in ClimatePositions, determined by the level of emissions in the 1990s and a number of continuously updated ‘Indicators’.
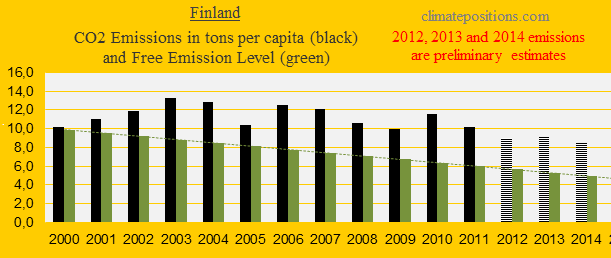
The diagram below shows the per capita CO2 Emissions from fossil fuels (without bunker fuels) and cement production since 2000. Emissions in 2012, 2013 and 2014 are preliminary estimates.
About 42% of the Finnish electricity generation was renewable in 2012 and renewable electricity covered 22% of the total energy consumption (Btu). However, 59% of the renewable electricity was generated by the convenient hydro generation.
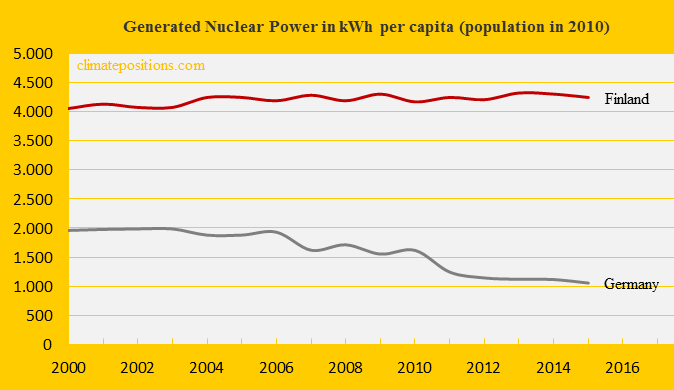
Finland is the world’s 3rd largest per capita Nuclear Power generator and 33% of the total electricity was generated by Nuclear Power in 2012. In ClimatePositions Nuclear Power generation must be reduced at the same rate as CO2 Emissions from fossil fuels and cement production, because dangerous radioactive nuclear waste is left to deal with for hundreds of future generations. The diagram below shows the per capita generation since 2000 in comparison with Germany.
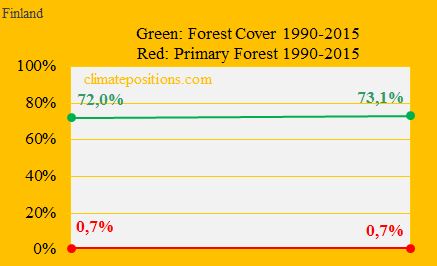
Although 73.1% of the Finnish land area is covered with forest only 0.7% (of the land area) is the precious Primary Forest. The diagram shows the stable development between 1990 and 2015.
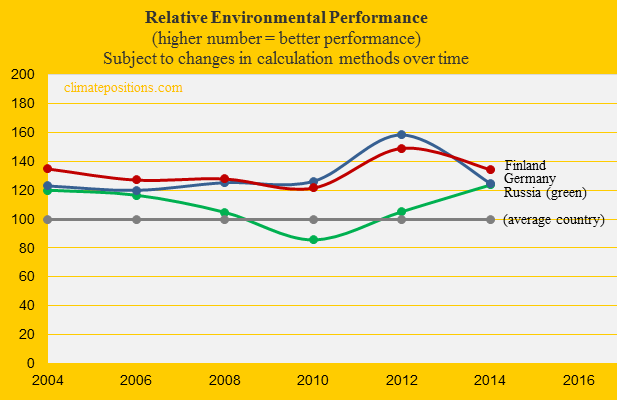
The relative Environmental Performance over time of Finland, Russia and Germany, with the world’s average set at 100, is shown below. The ‘Environmental Performance Index’ published January 2016 (data-year is set at 2014 in the diagram) ranked Finland 1st among 180 countries. Only on the indicators of “Forests” and to a lesser extent “Agriculture” the performance is notably poor. See more ‘Details on the Finnish performance’.
The next diagram shows the development of GDP(ppp-$) since 2000, in comparison with the same four countries and the world average. OECD’s ‘Economic Survey on Finland’ by January 2016 states: “The economy is weak and public debt is rising. Government spending as a share of GDP is the highest in the OECD. (..) Finland has been hit hard by several shocks, in addition to the global economic slowdown. Electronic exports, demand for paper and exports to Russia have collapsed.”

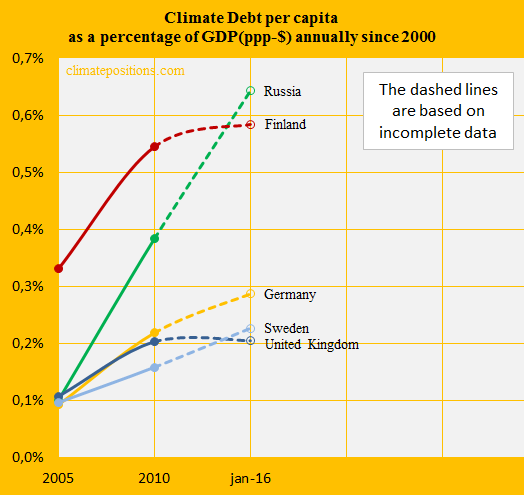
By January 2016 Finland’s Climate Debt’s share of the GDP(ppp-$), annually since 2000, was 0.58% and the ‘Ranking’ was 19th; in 2010 the ranking was 11th. The performance since 2005 is shown in the diagram below along the same group of countries.
.
.
A hypothetical example: If 10.0% of Finland’s Forest Cover was Primary Forests today, instead of 0.9%, then the current Climate Debt would have been $13.9 billion, instead of $16,8 (18% decrease).
.
Updated data and diagrams of all ‘Indicators‘ and all countries in ClimatePositions are available in the menu ‘Calculations (Excel)’.
Data on carbon emissions (CO2 Emissions) from fossil fuels (without bunkers) and cement production are from Global Carbon Project (CDIAC); (links in the menu “Calculations”).
Data on national Nuclear Power generation: World Nuclear Association (links in the menu “Calculations”).
Source on Environmental Performance: Yale and Columbia University reports, published 2006-2016 (links in the menu “Calculations”).
Information on national GDP(ppp-$) per capita: Worldbank (links in the menu “Calculations”).
Drawing by Claus Andersen, 2016.
Comments are closed.