Climate Debt: South Korea now ranks 11th (Nuclear Power generation worsens the trend)

South Korea is responsible for 3.9% of the global Climate Debt of $5.7 trillion, accumulated since 2000. The per capita Climate Debt is $4,404 which ‘Ranks’ South Korea 11th among 148 countries, compared to 12th in 2010. Rankings are available in the menu “Climate Debt”. The following examines the CO2 Emissions, Nuclear Power, GDP(ppp-$) and Climate Debt, in comparison with four other large Nuclear Power generators.
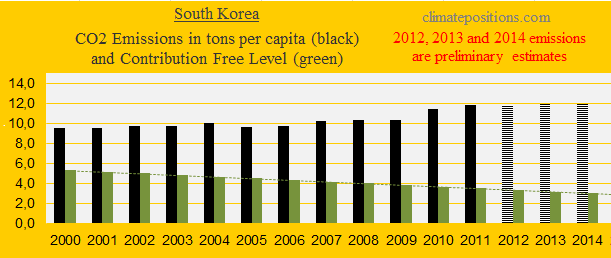
The first diagram shows the South Korean per capita CO2 Emissions from fossil fuels (without bunker fuels) and cement production in decades in comparison with the world average. CO2 Emissions since 2012 are preliminary estimates. From 7.6 tons in the 1990s the level increased to 11.8 tons on average between 2000 and 2014 (preliminary). The green bars are the Climate Debt Free Level in ClimatePositions, determined by the level of emissions in the 1990s and a number of continuously updated ‘Indicators’. 
The diagram below shows the per capita CO2 Emissions from fossil fuels (without bunker fuels) and cement production since 2000. Emissions in 2012, 2013 and 2014 are preliminary estimates.
The South Korean indifference to global climate and the living conditions of coming generations can be framed as follows: It has been known for decades that CO2 Emissions causes dangerous global warming (read ‘Early history of global warming science and predictions’). Nevertheless, South Korea emitted 107% more CO2 per capita in 2014 (preliminary estimate) than in 1990 … whereas 48% reduction during the 24-year period is required in ClimatePositions. This discrepancy explains the huge gabs between the green bars and the black bars in the diagrams. Note that the growth in Nuclear Power generation also enlarges the discrepancy (read about Nuclear Power below).
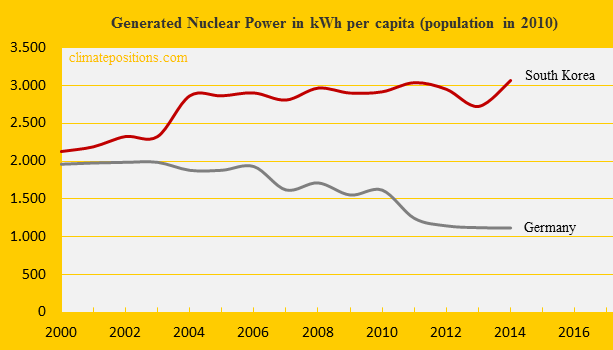
South Korea is the world’s 4th largest Nuclear Power generator and the 6th largest generator per capita. The diagram below shows the per capita generation since 2000 in comparison with Germany. South Korea’s total generation increased by 5% between 2010 and 2014, while the world’s total generation decreased by 8%. Today, around 6% of the world’s Nuclear Power is generated in South Korea. According to ‘World Nuclear Association’ Nuclear Energy provides 30.4% of the South Korean electricity and capacity is planned to increase by 70% by 2029, and maintain this level to 2035.
In ClimatePositions Nuclear Power generation must be reduced at the same rate as CO2 Emissions from fossil fuels and cement production, because dangerous radioactive nuclear waste is left for hundreds of future generations to deal with.
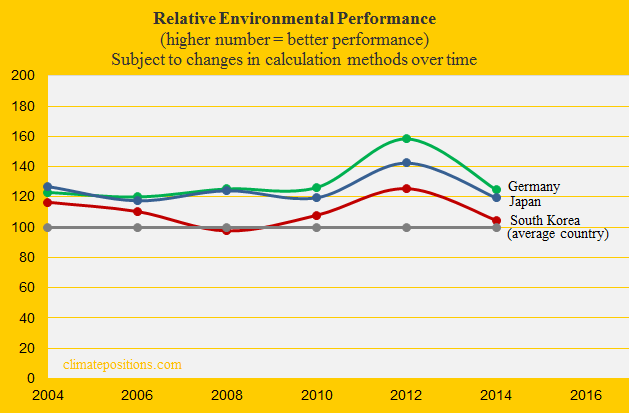
The relative Environmental Performance over time of South Korea, Germany and Japan, with the world’s average set at 100, is shown below. The ‘Environmental Performance Index’ published January 2016 (data-year is set at 2014 in the diagram) ranks South Korea 80th among 180 countries. See ‘Details on the South Korean performance’. The previous Index published in 2014 ranked South Korea 43rd.
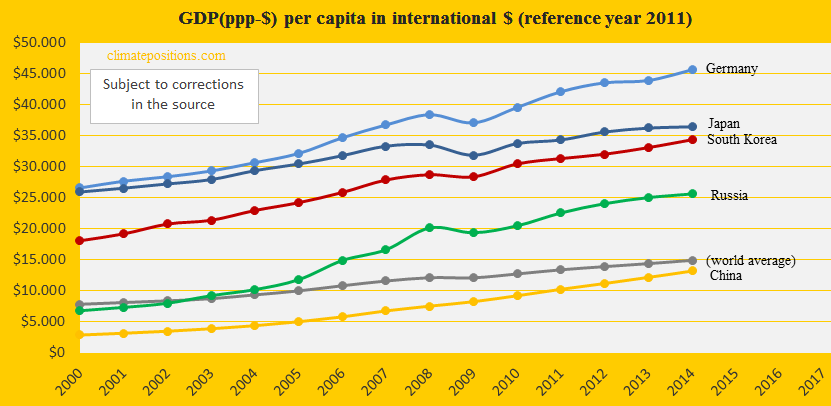
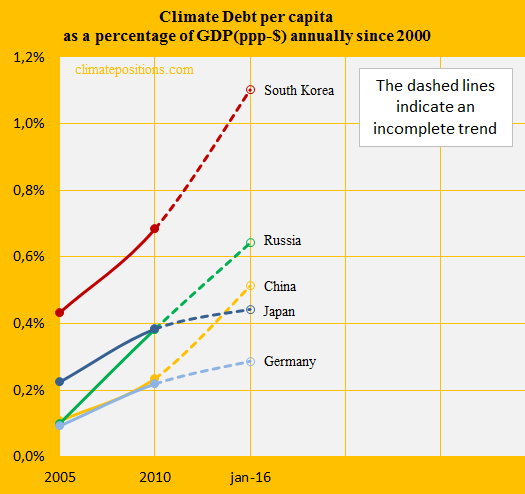
The diagram below shows the development of GDP(ppp-$) since 2000, in comparison with China, Russia, Japan, Germany and the world average.
By January 2016 the South Korean Climate Debt’s share of the GDP(ppp-$), annually since 2000, was 1.10% and the ‘Ranking’ was 6th; in 2010 the ranking was 9th. The miserable performance since 2005 is shown in the diagram below along the same group of countries.
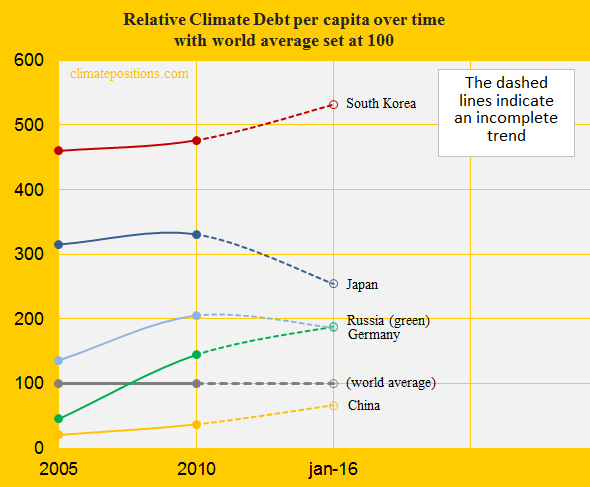
The last diagram shows the per capita Climate Debt since 2005, with the world average set at 100. In real money the accumulated total Climate Debt of South Korea increased from $89 billion in 2010 to $222 billion by January 2016 (see the ‘Ranking’), or 3.90% of the global Climate Debt.
.
Updated data and diagrams of all ‘Indicators‘ and all countries in ClimatePositions are available in the menu ‘Calculations (Excel)’.
Information on national GDP(ppp-$) per capita: Worldbank (links in the menu “Calculations”).
Data on carbon emissions (CO2 Emissions) from fossil fuels (without bunkers) and cement production are from Global Carbon Project (CDIAC); (links in the menu “Calculations”).
Source on Environmental Performance: Yale and Columbia University reports, published 2006-2016 (links in the menu “Calculations”).
Data on national Nuclear Power generation: World Nuclear Association (links in the menu “Calculations”).
Drawing by Claus Andersen, 2016.
Comments are closed.